Build a Grafana dashboard
Published

Day 76 of #90DaysOfDevOps
Tasks:
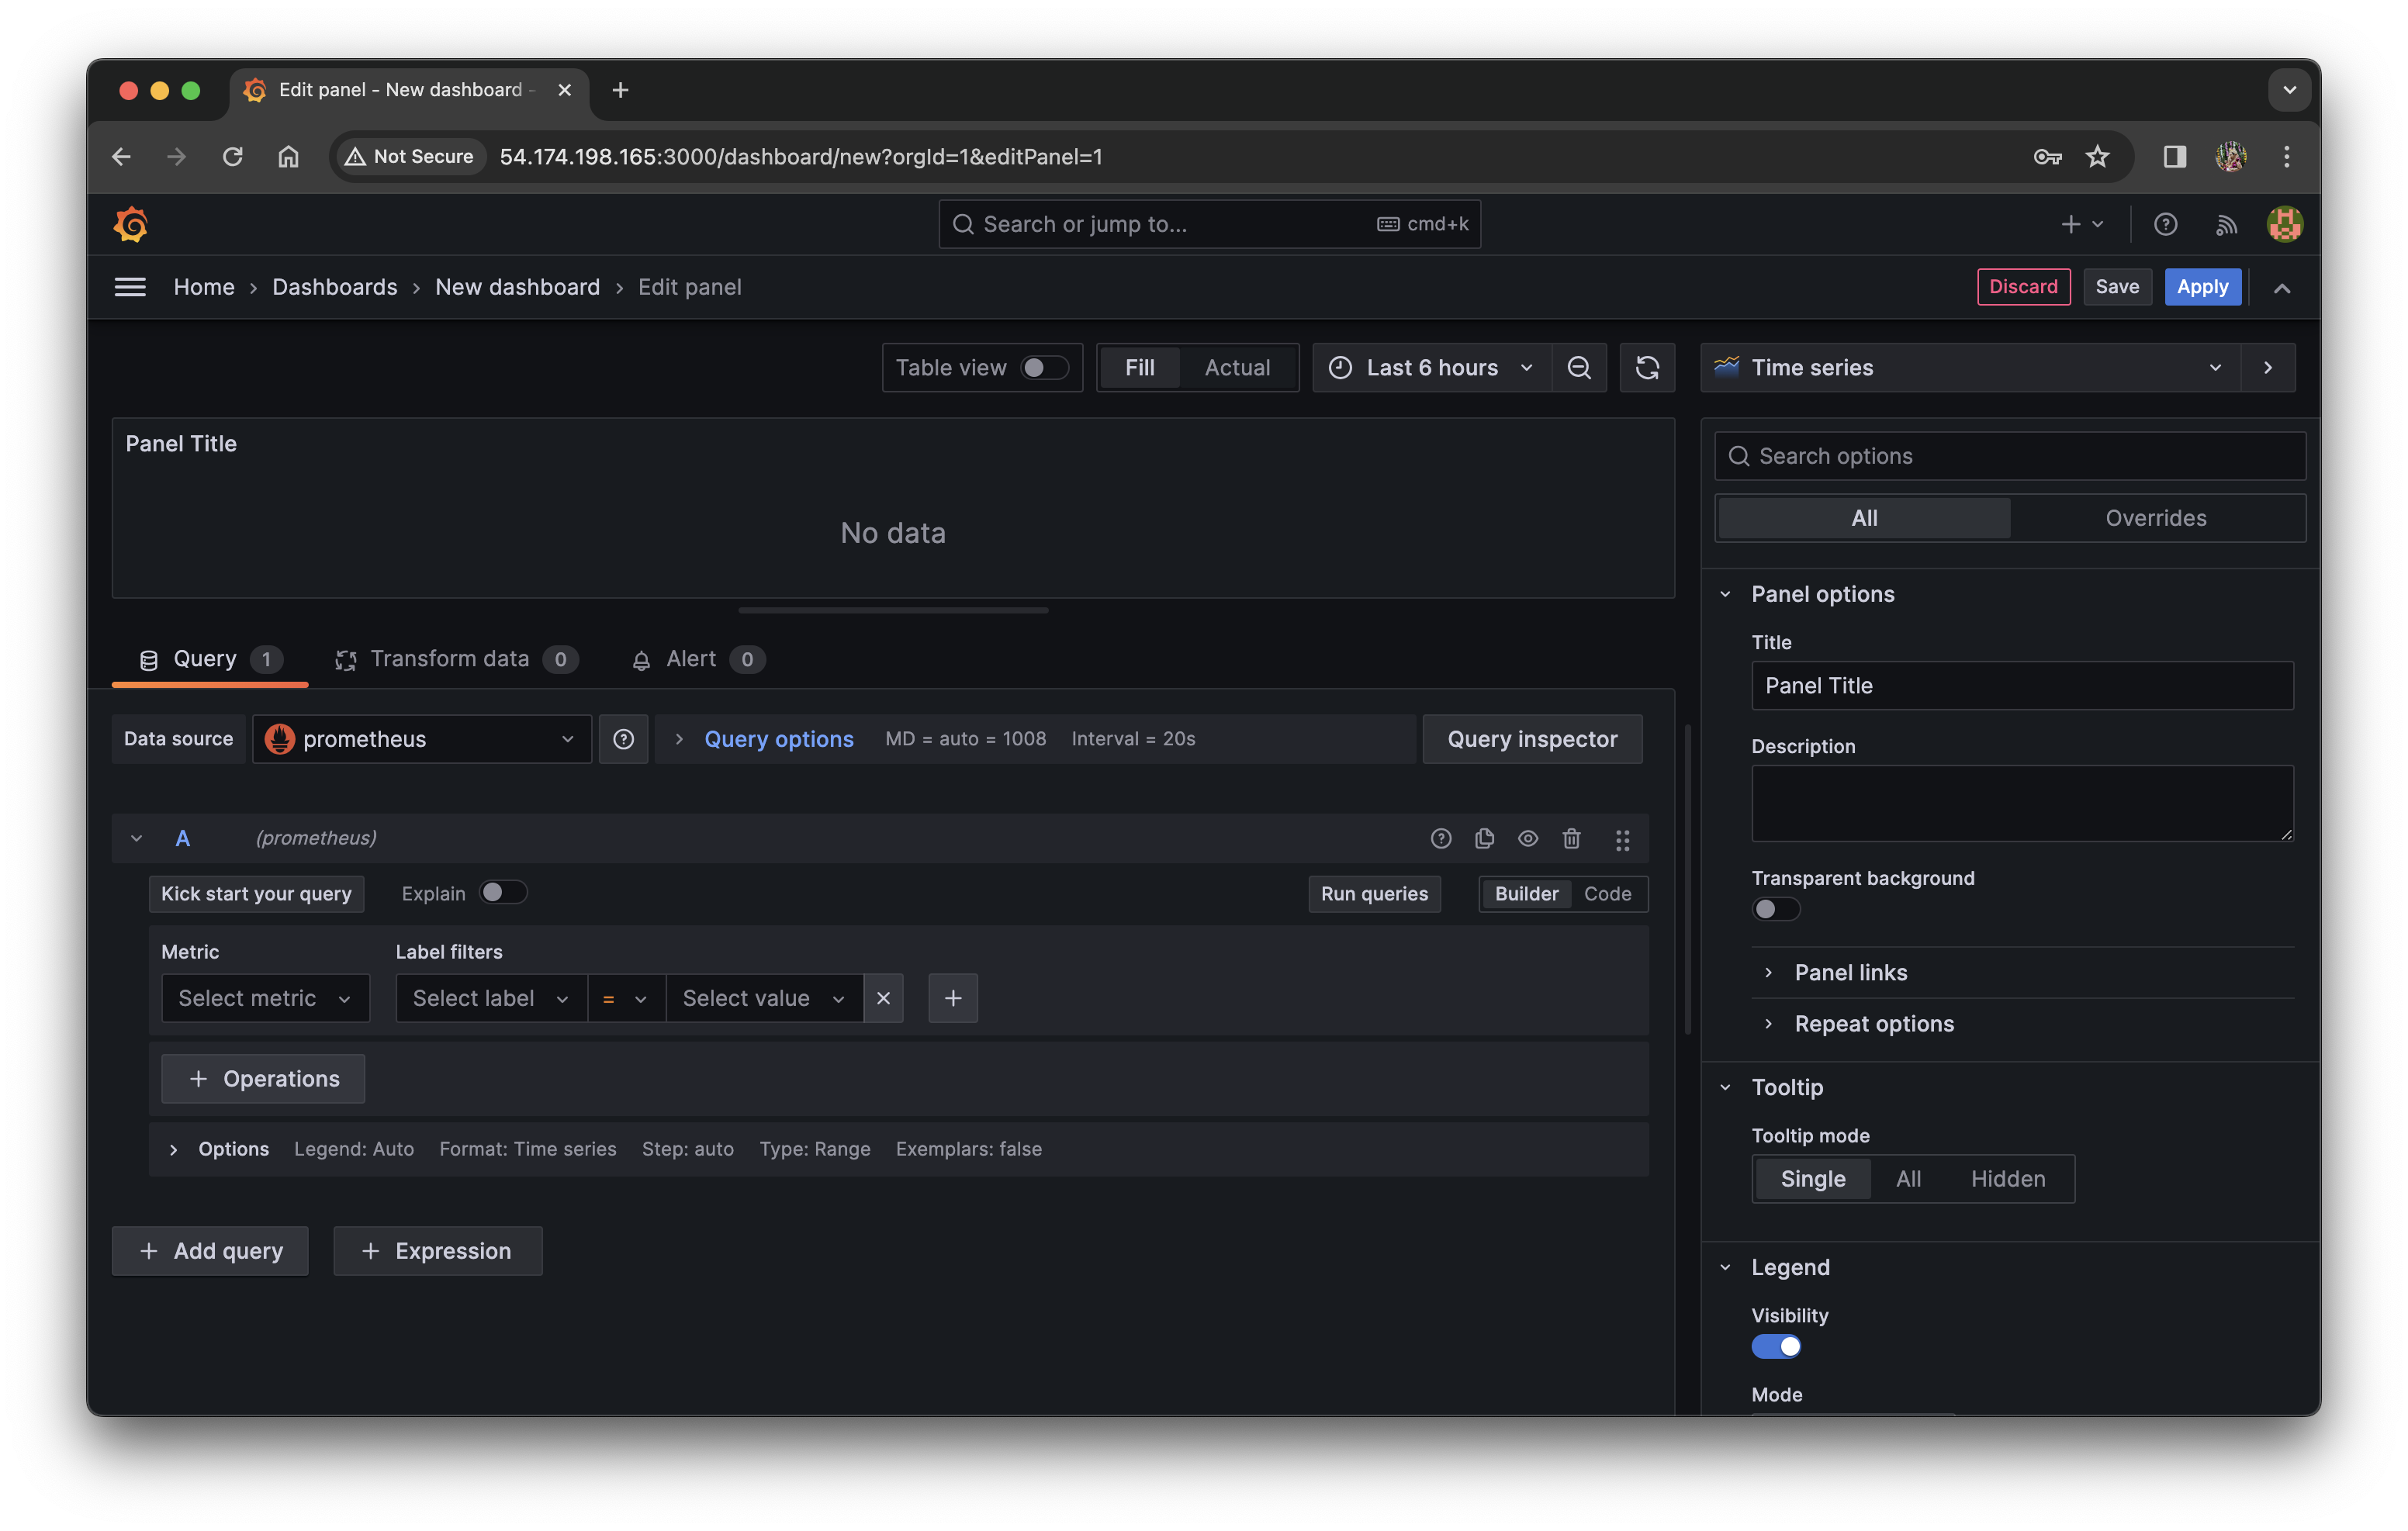
In the sidebar, hover your cursor over the Create (plus sign) icon and then click Dashboard.
Click Add a new panel.


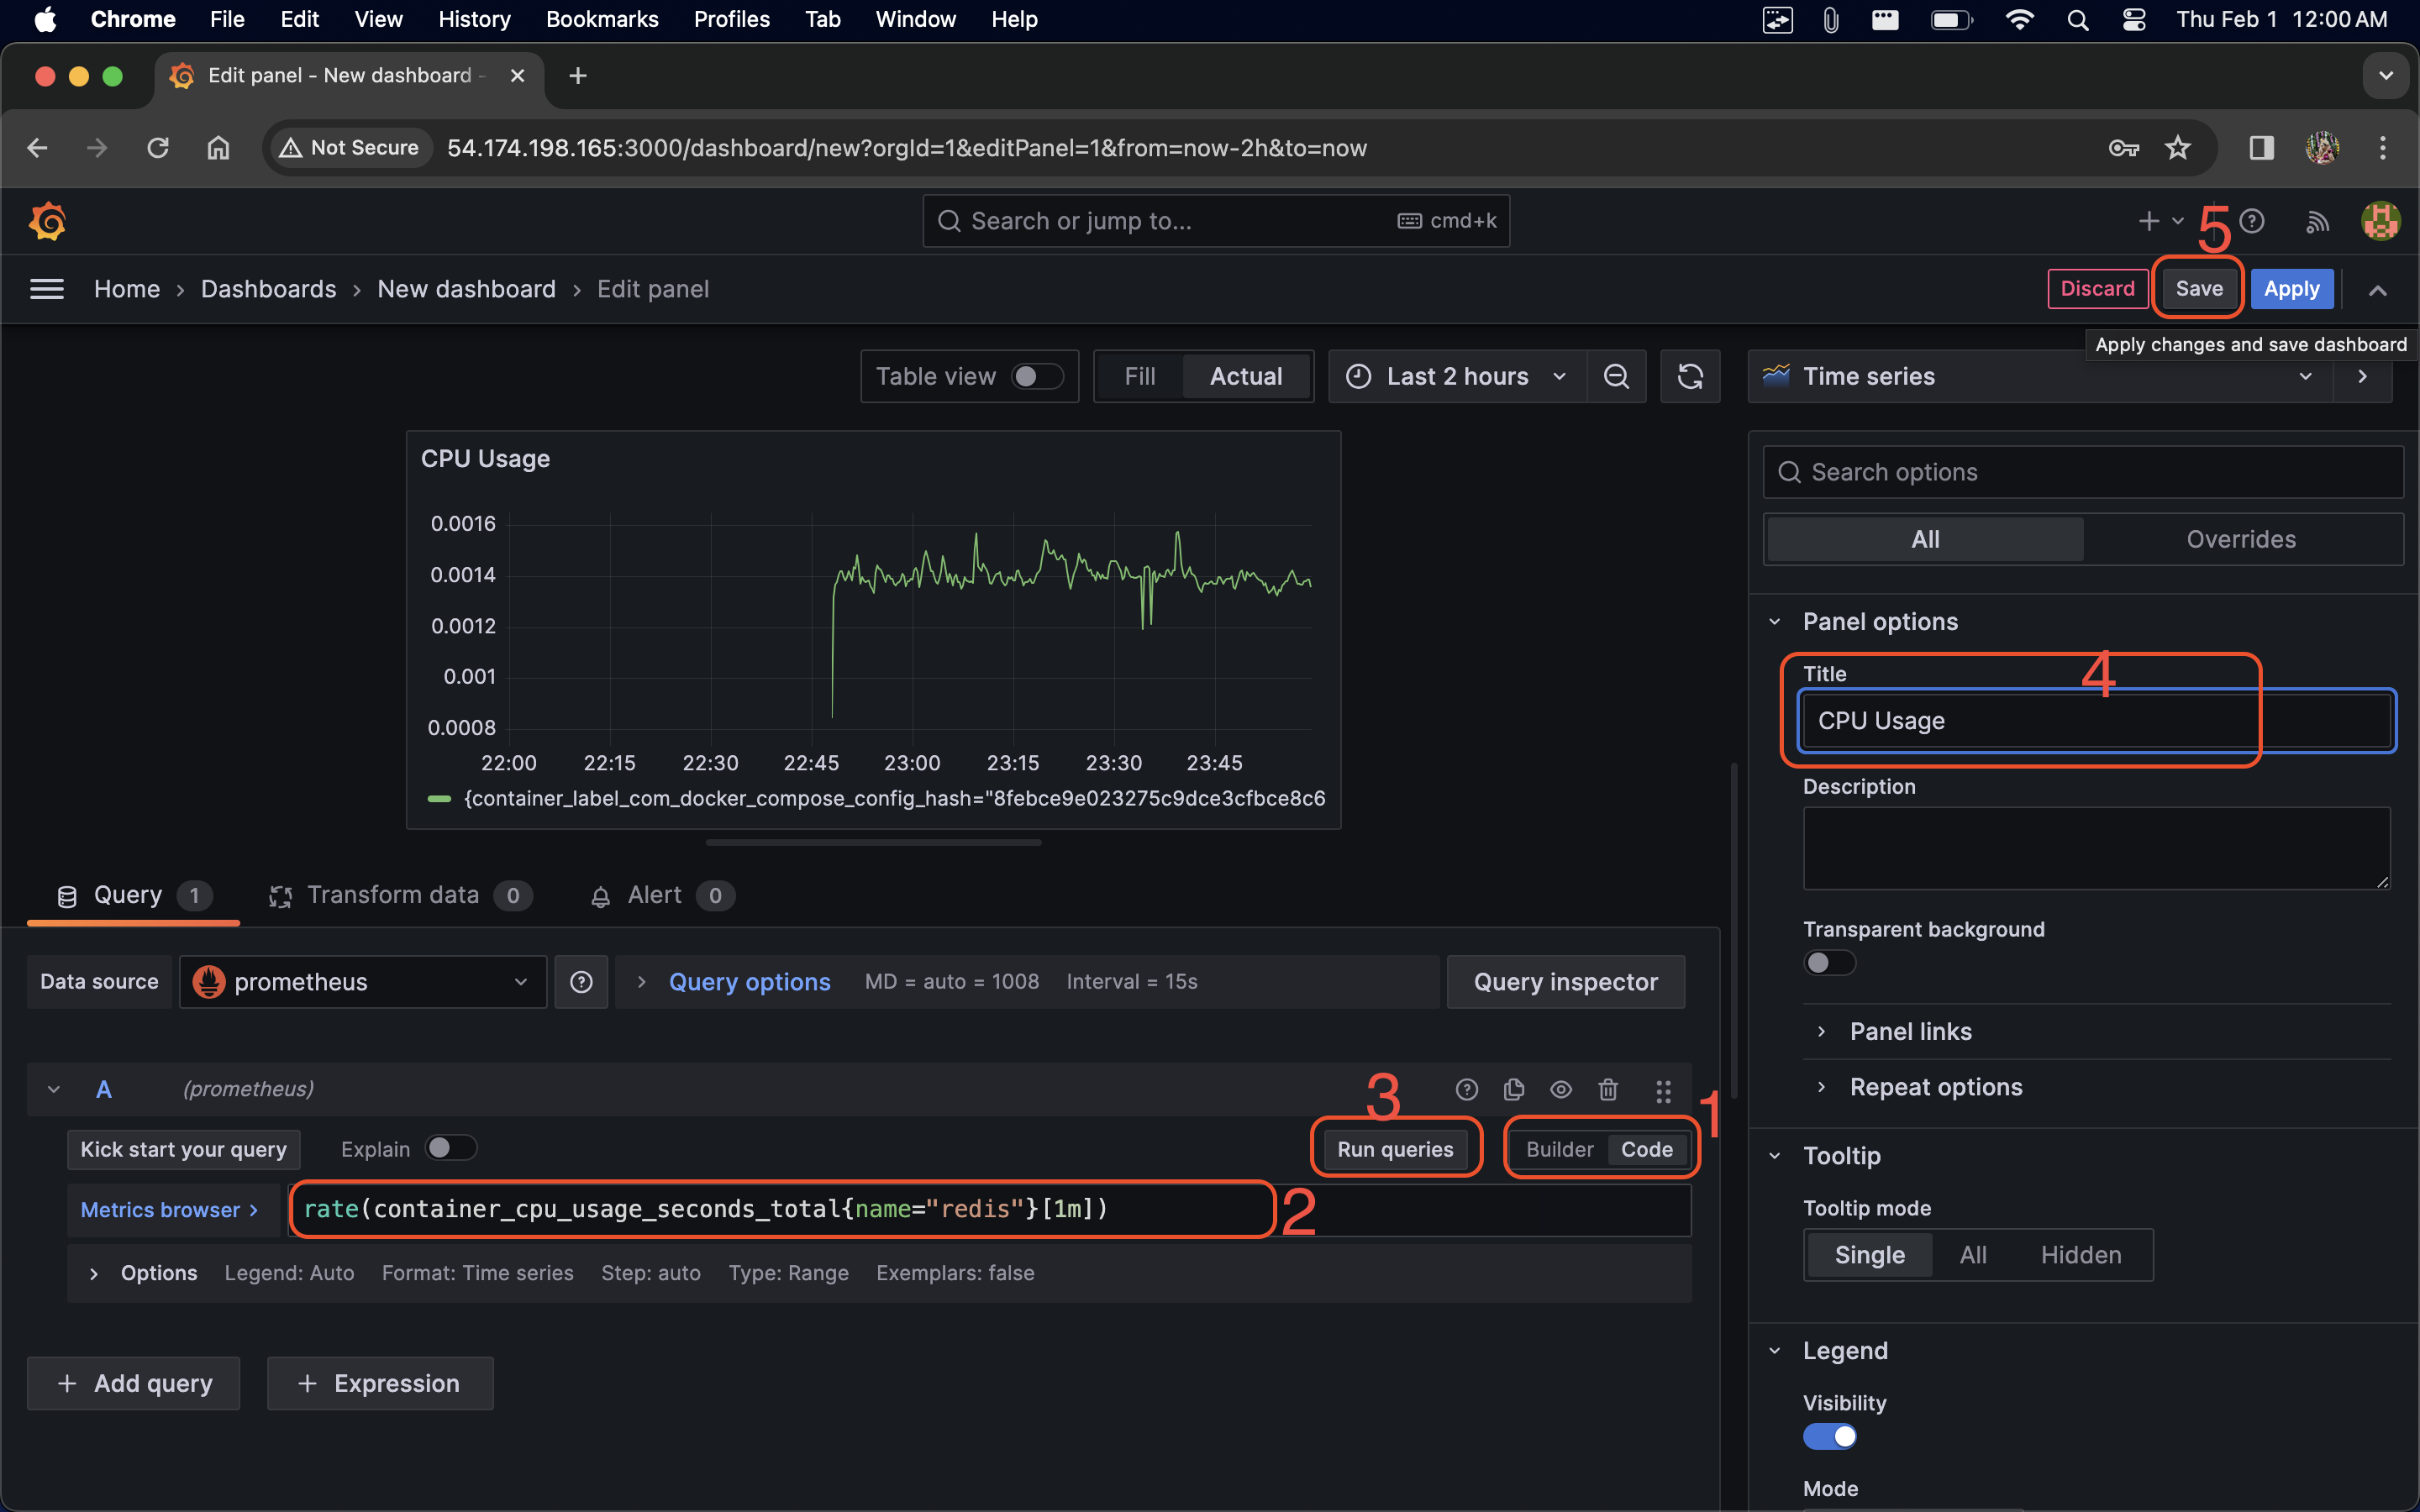
In the Query editor below the graph, enter the query from earlier and then press Shift + Enter:
rate(container_cpu_usage_seconds_total{name="redis"}[1m])
In the Panel editor on the right, under Settings, change the panel title to “CPU Usage”.
Click Apply in the top-right corner to save the panel and go back to the dashboard view.
Click the Save dashboard (disk) icon at the top of the dashboard to save your dashboard.
Enter a name in the Dashboard name field and then click Save.

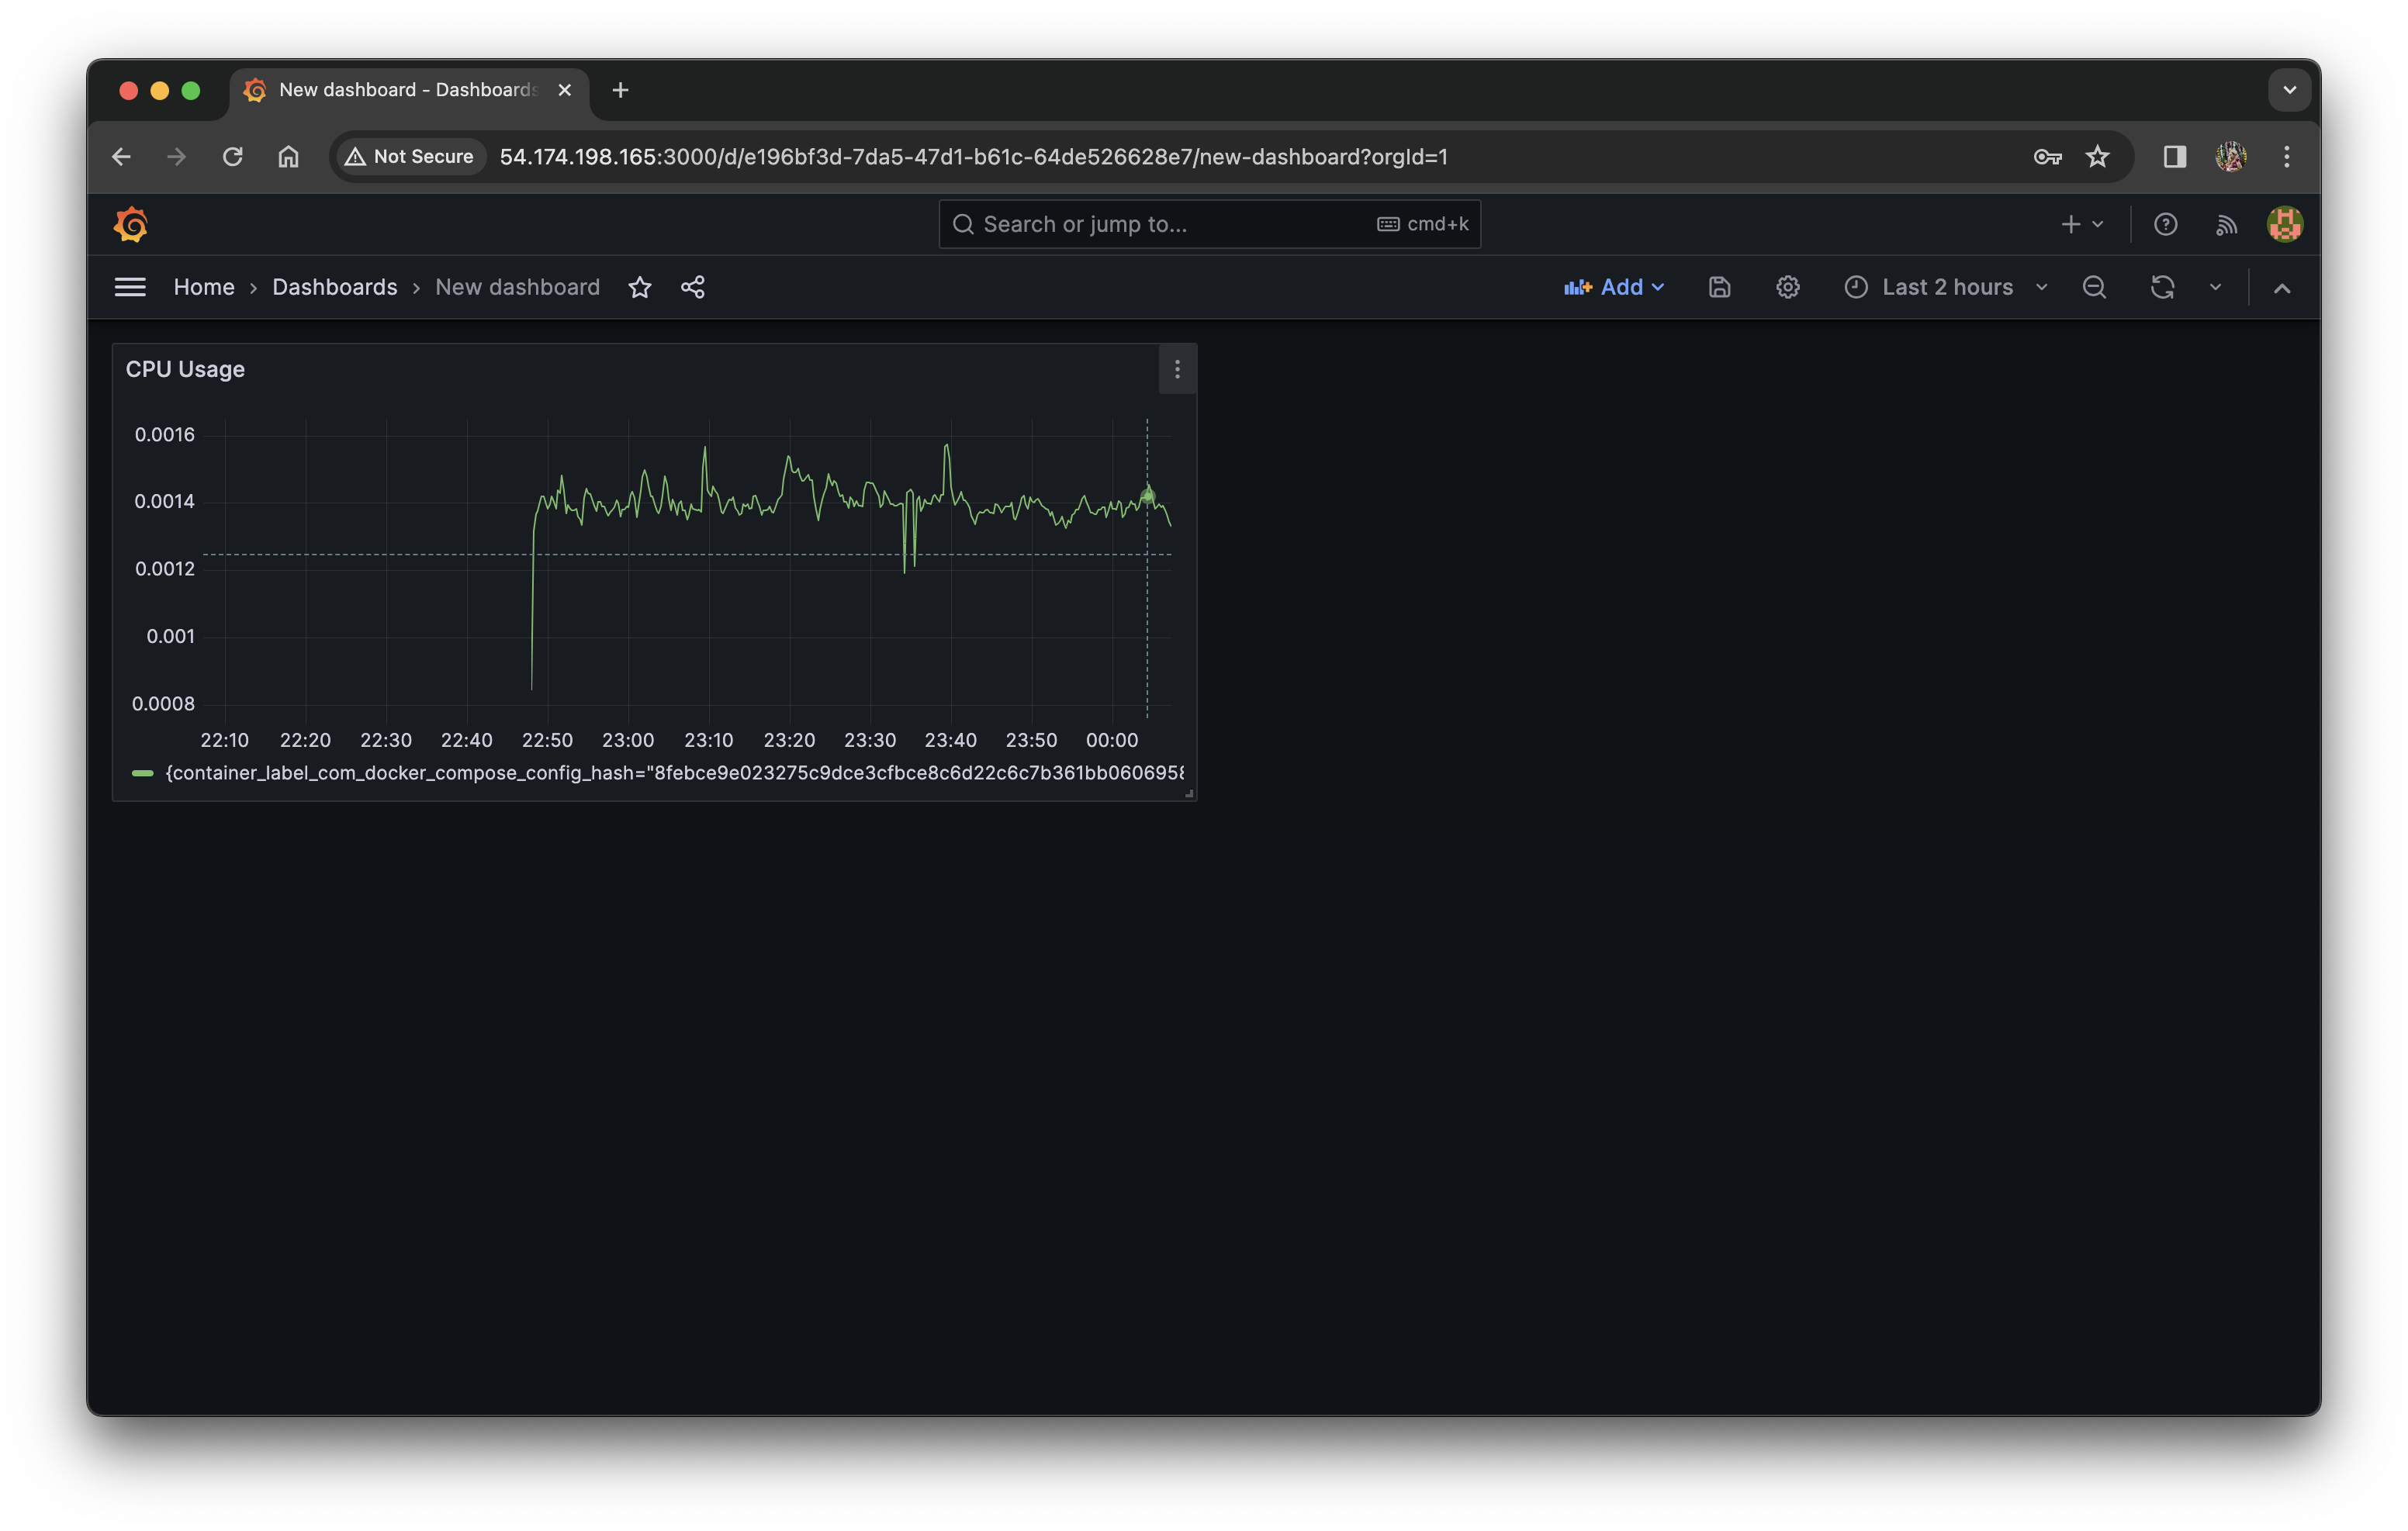
Done! The dashboard is read. You can add many items as your need.


