Grafana Cloud Alerting
Day 77 of #90DaysOfDevOps
Tasks:
Setup Grafana cloud
Setup sample alerting
Grafana Alerting allows you to learn about problems in your systems moments after they occur. Create, manage, and take action on your alerts in a single, consolidated view, and improve your team’s ability to identify and resolve issues quickly.
Grafana Alerting is available for Grafana OSS, Grafana Enterprise, or Grafana Cloud. With Mimir and Loki alert rules you can run alert expressions closer to your data and at massive scale, all managed by the Grafana UI you are already familiar with.
Task #1: Setup Garana Cloud
Click on Create Free Account, and crean an account.
Then click on connect cloud service and select your cloud.
Done! the cloud has been setup. Now let’s go further with setting up the sample alerting on grafana.
Task #2: Setup sample alerting
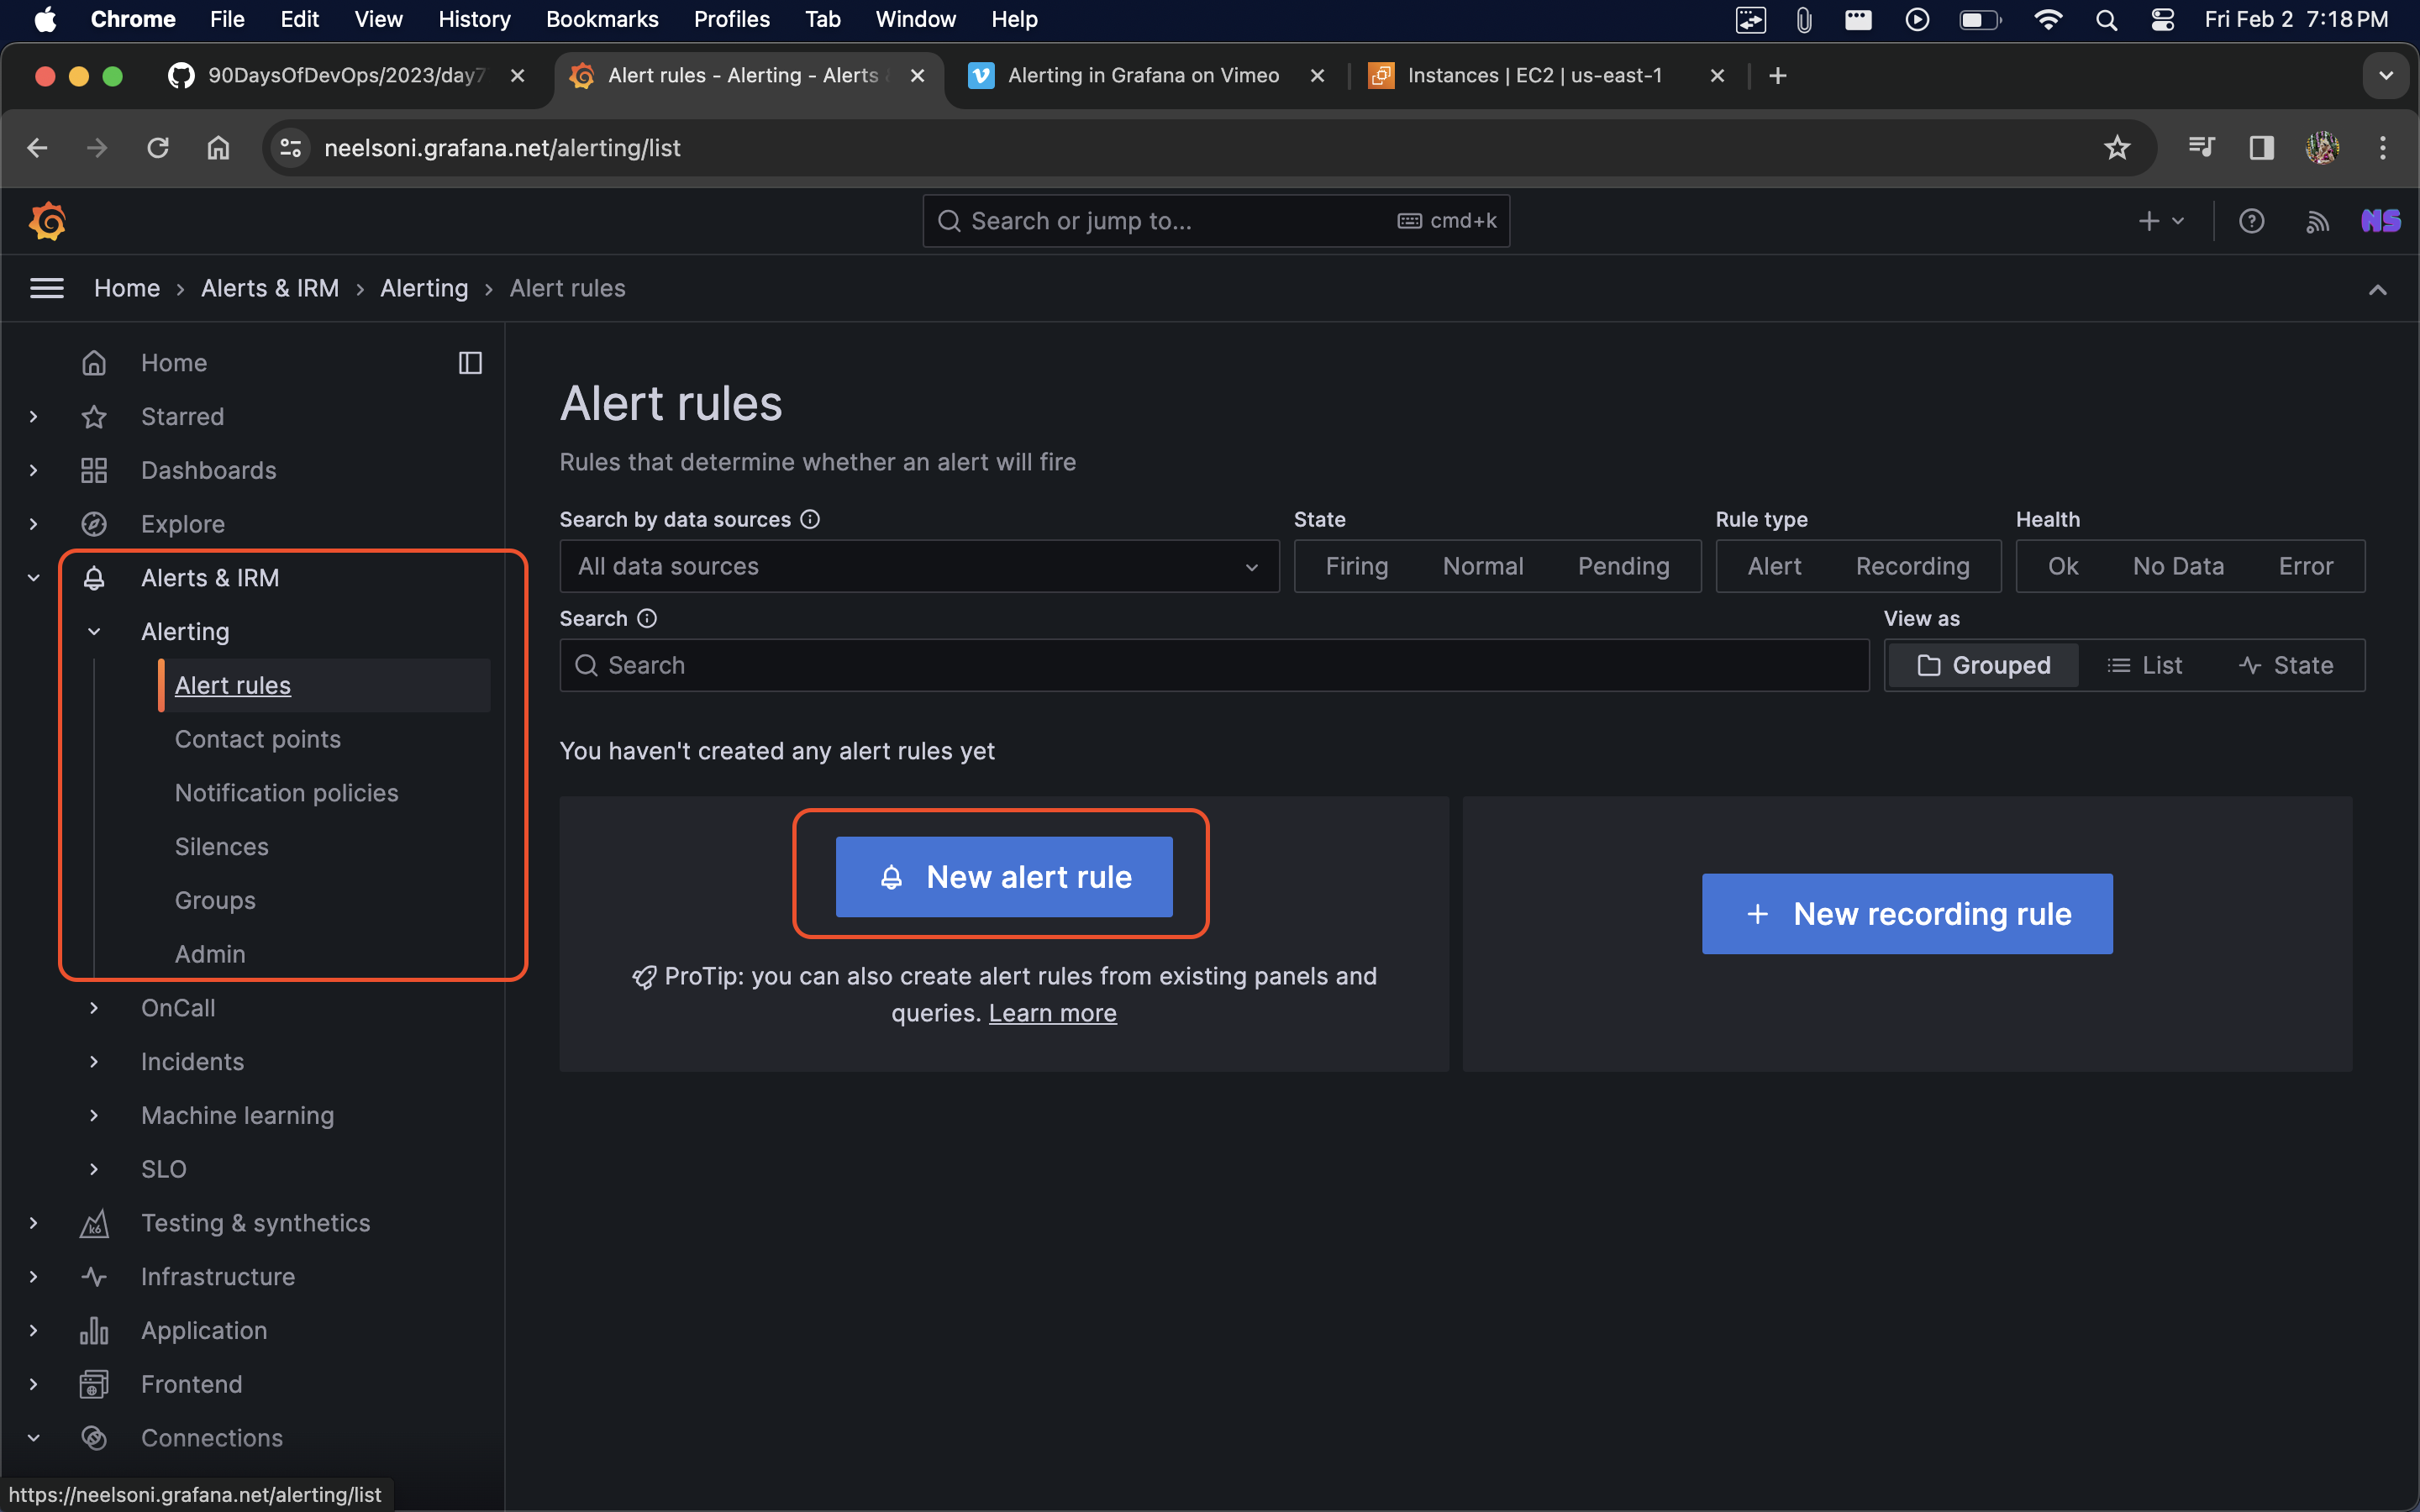
From left hand side panel, click on Alert & IRM.
In the alerting click on Alert Rules.
New alert rule.
Enter Name and Save.

Set eveluation behavior > Select cloud > Create new group > Enter name and evaluation timer
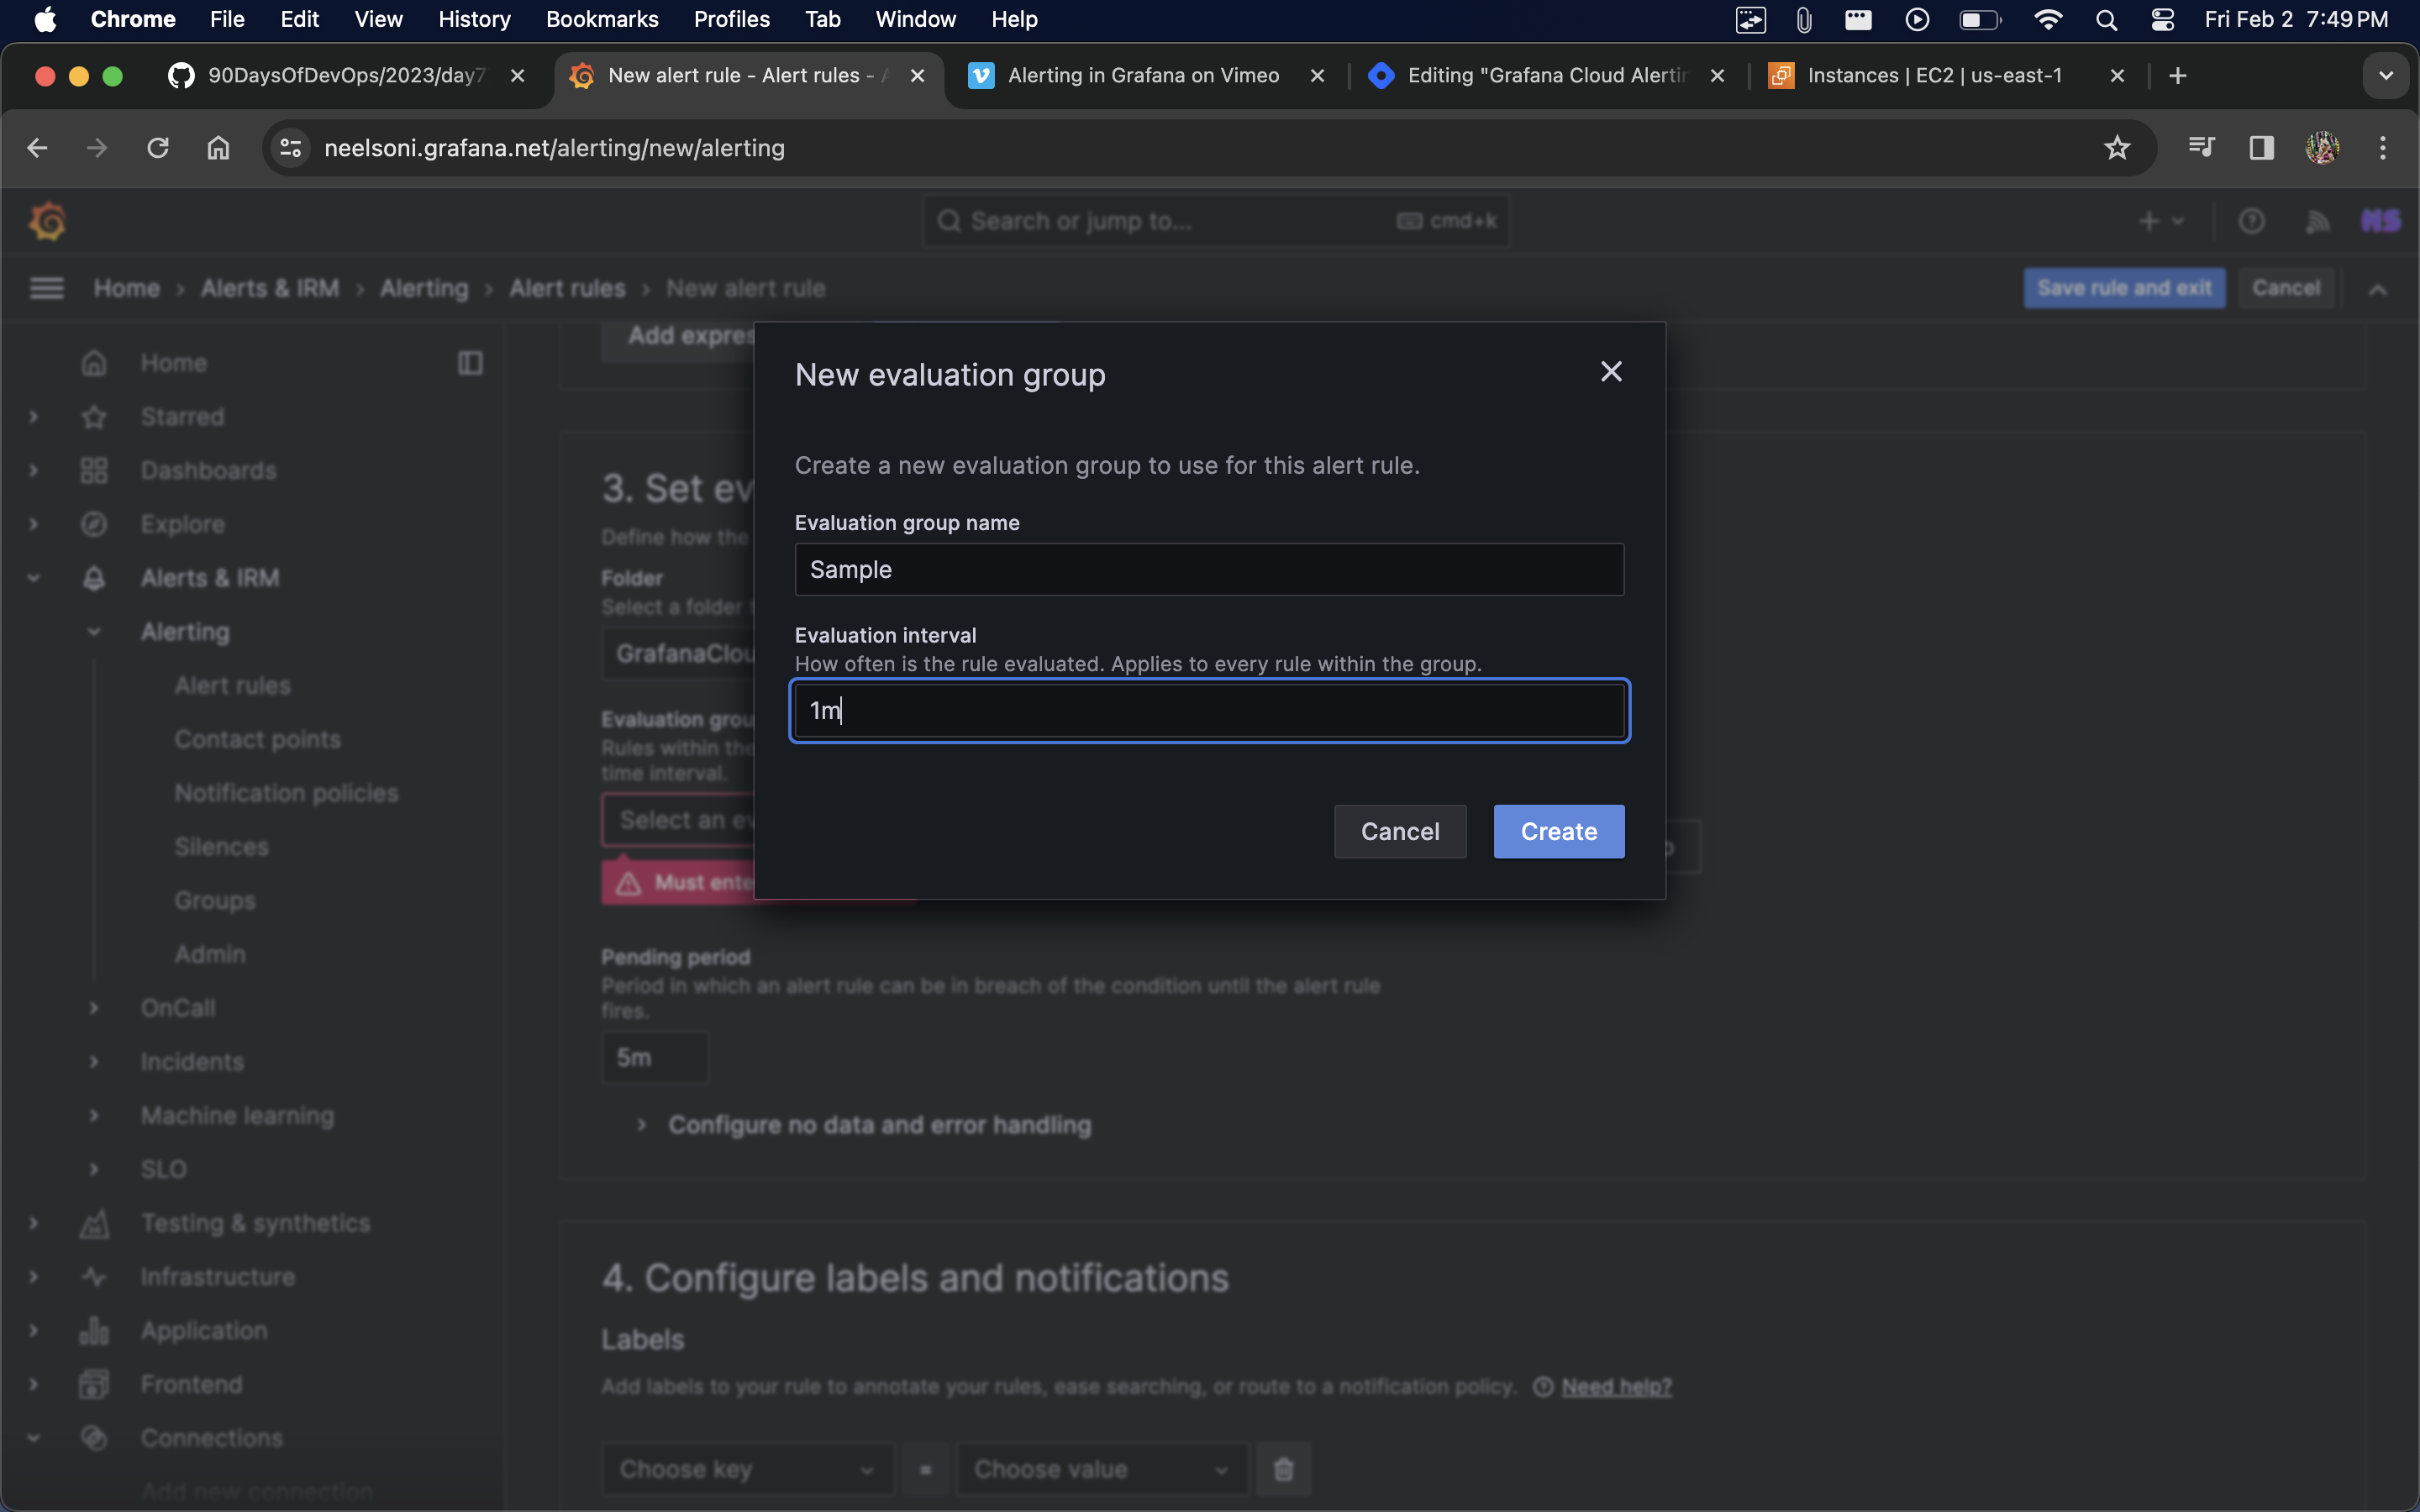
Click on Save and Exit.
Sample alerting is created.


