Connecting EC2 with Grafana

Day 74 of #90DaysOfDevOps
Step 1: Launch an EC2 instance and install Grafana.
Refer to my previous blog for the process: https://neel-soni.hashnode.dev/setup-grafana-in-your-local-environment-on-aws-ec2
Step 2: Install and configure docker
Loki and Promtail works with docker, hence docker should be in your system. Let's install it first.
sudo apt-get install -y docker.io docker-compose
sudo chown $USER /var/run/docker.sock
Now if you do docker ps you will get columns of Container id, image etc of docker.

Docker installed.
Step 3: Install and configure Loki and Promtail
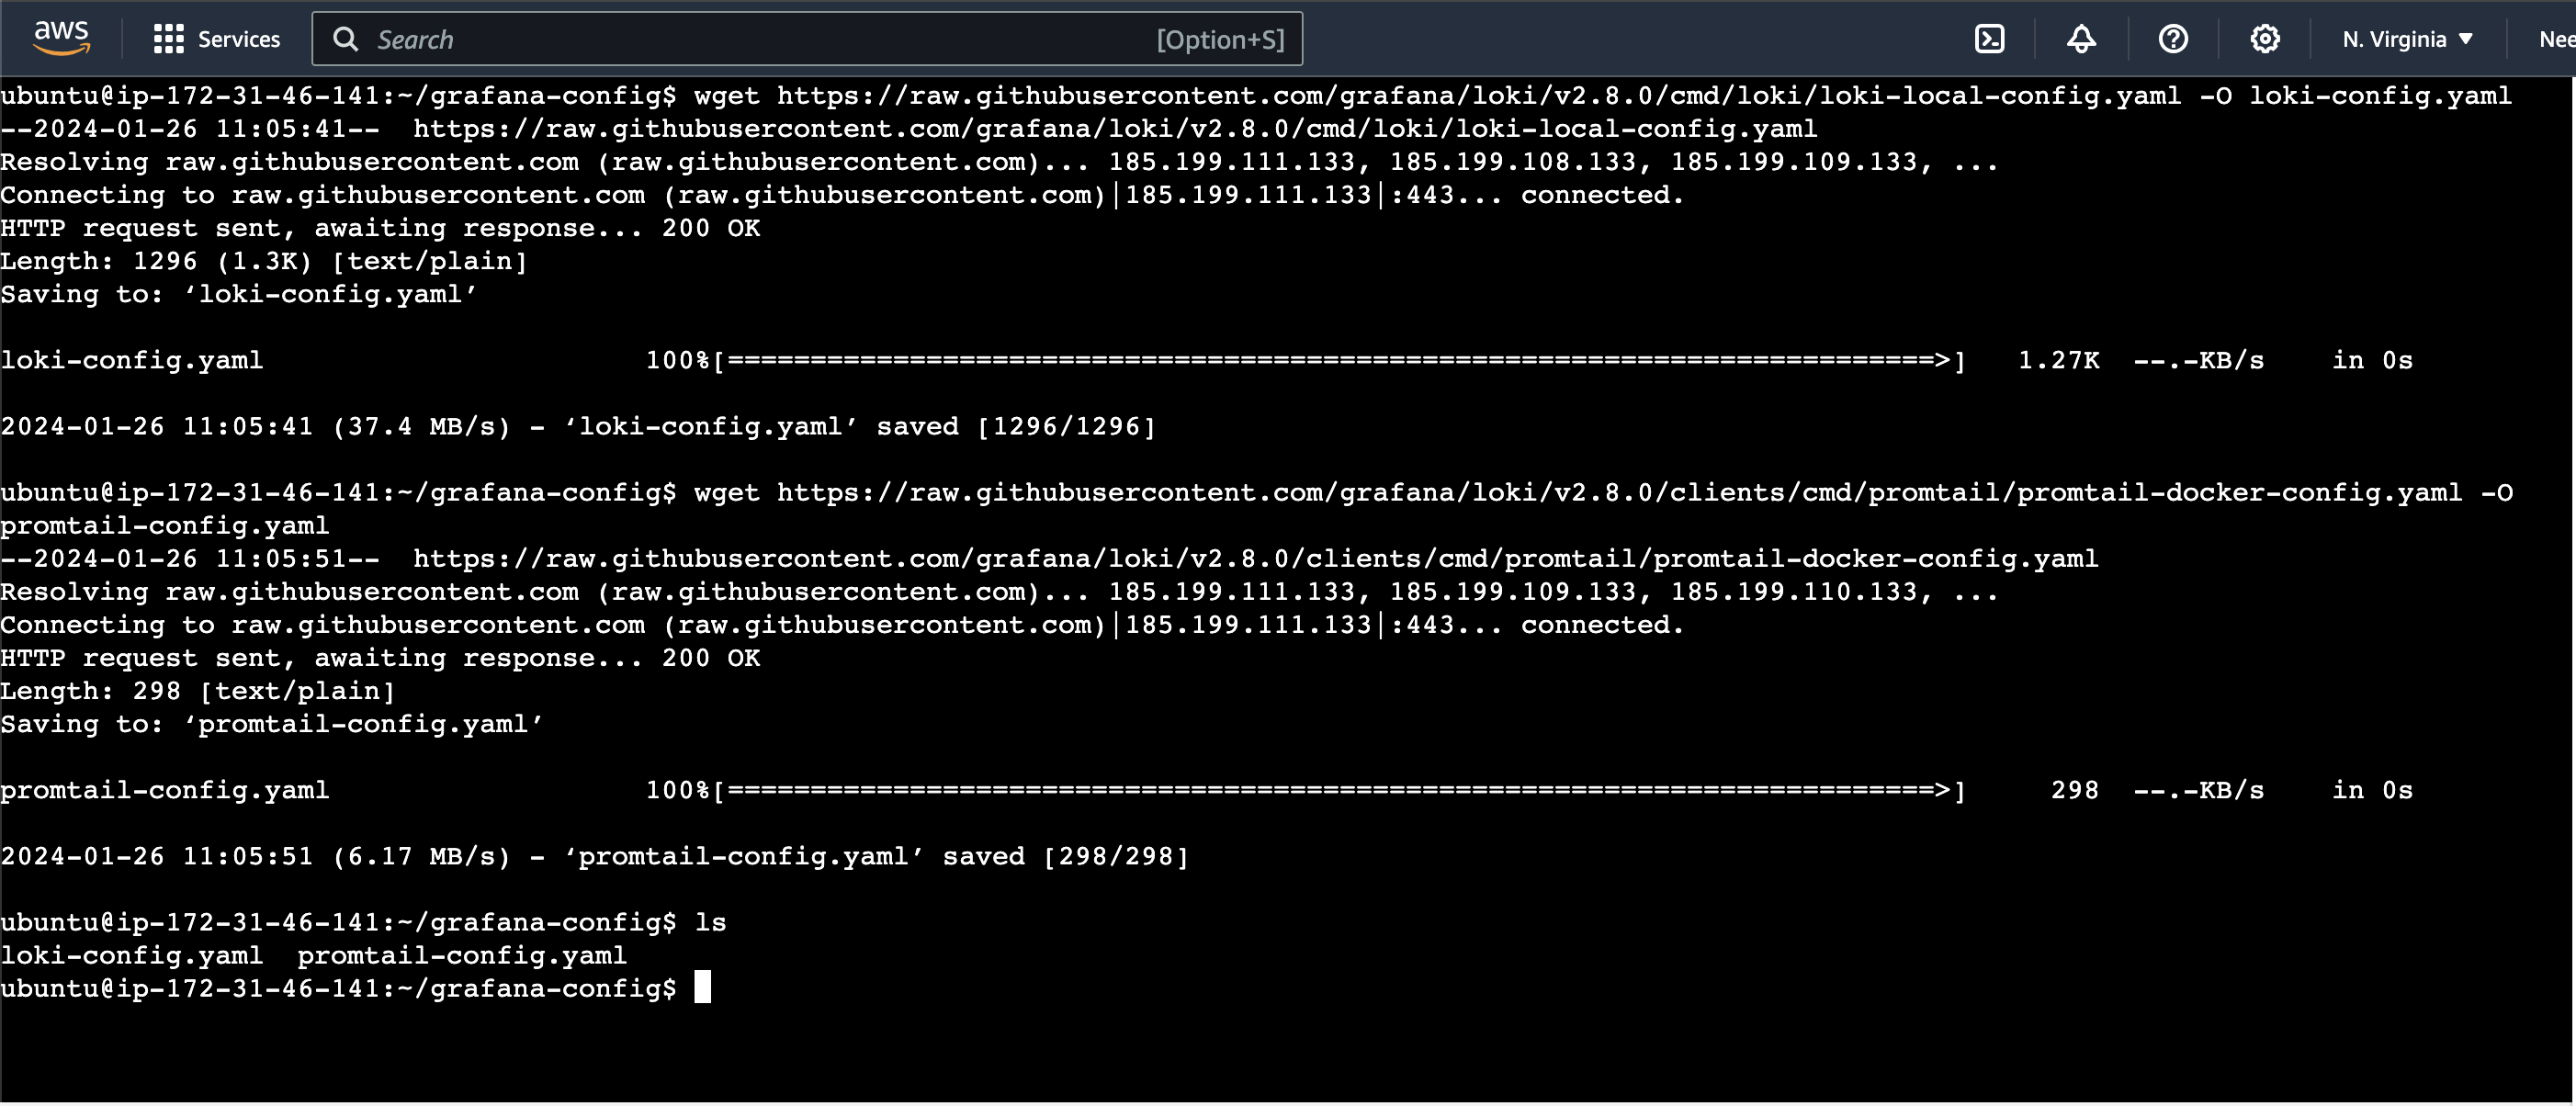
Make a directory grafana-configs and download config files of Loki and Promtail.
Run below commands:
# Loki config file
wget https://raw.githubusercontent.com/grafana/loki/v2.8.0/cmd/loki/loki-local-config.yaml -O loki-config.yaml

# Promtail config file
wget https://raw.githubusercontent.com/grafana/loki/v2.8.0/clients/cmd/promtail/promtail-docker-config.yaml -O promtail-config.yaml
Run both the files with docker one by one.
Run Loki Docker container
docker run -d --name loki -v $(pwd):/mnt/config -p 3100:3100 grafana/loki:2.8.0 --config.file=/mnt/config/loki-config.yaml
Run Promtail Docker container
docker run -d --name promtail -v $(pwd):/mnt/config -v /var/log:/var/log --link loki grafana/promtail:2.8.0 --config.file=/mnt/config/promtail-config.yaml

Step 4: Open ports
As the Loki works on port 3100, open the port in security group.

Now copy and paste ip address of the instance with the port 3100 and /ready i.e http://<ip>:3100/ready This will show the status of Loki.
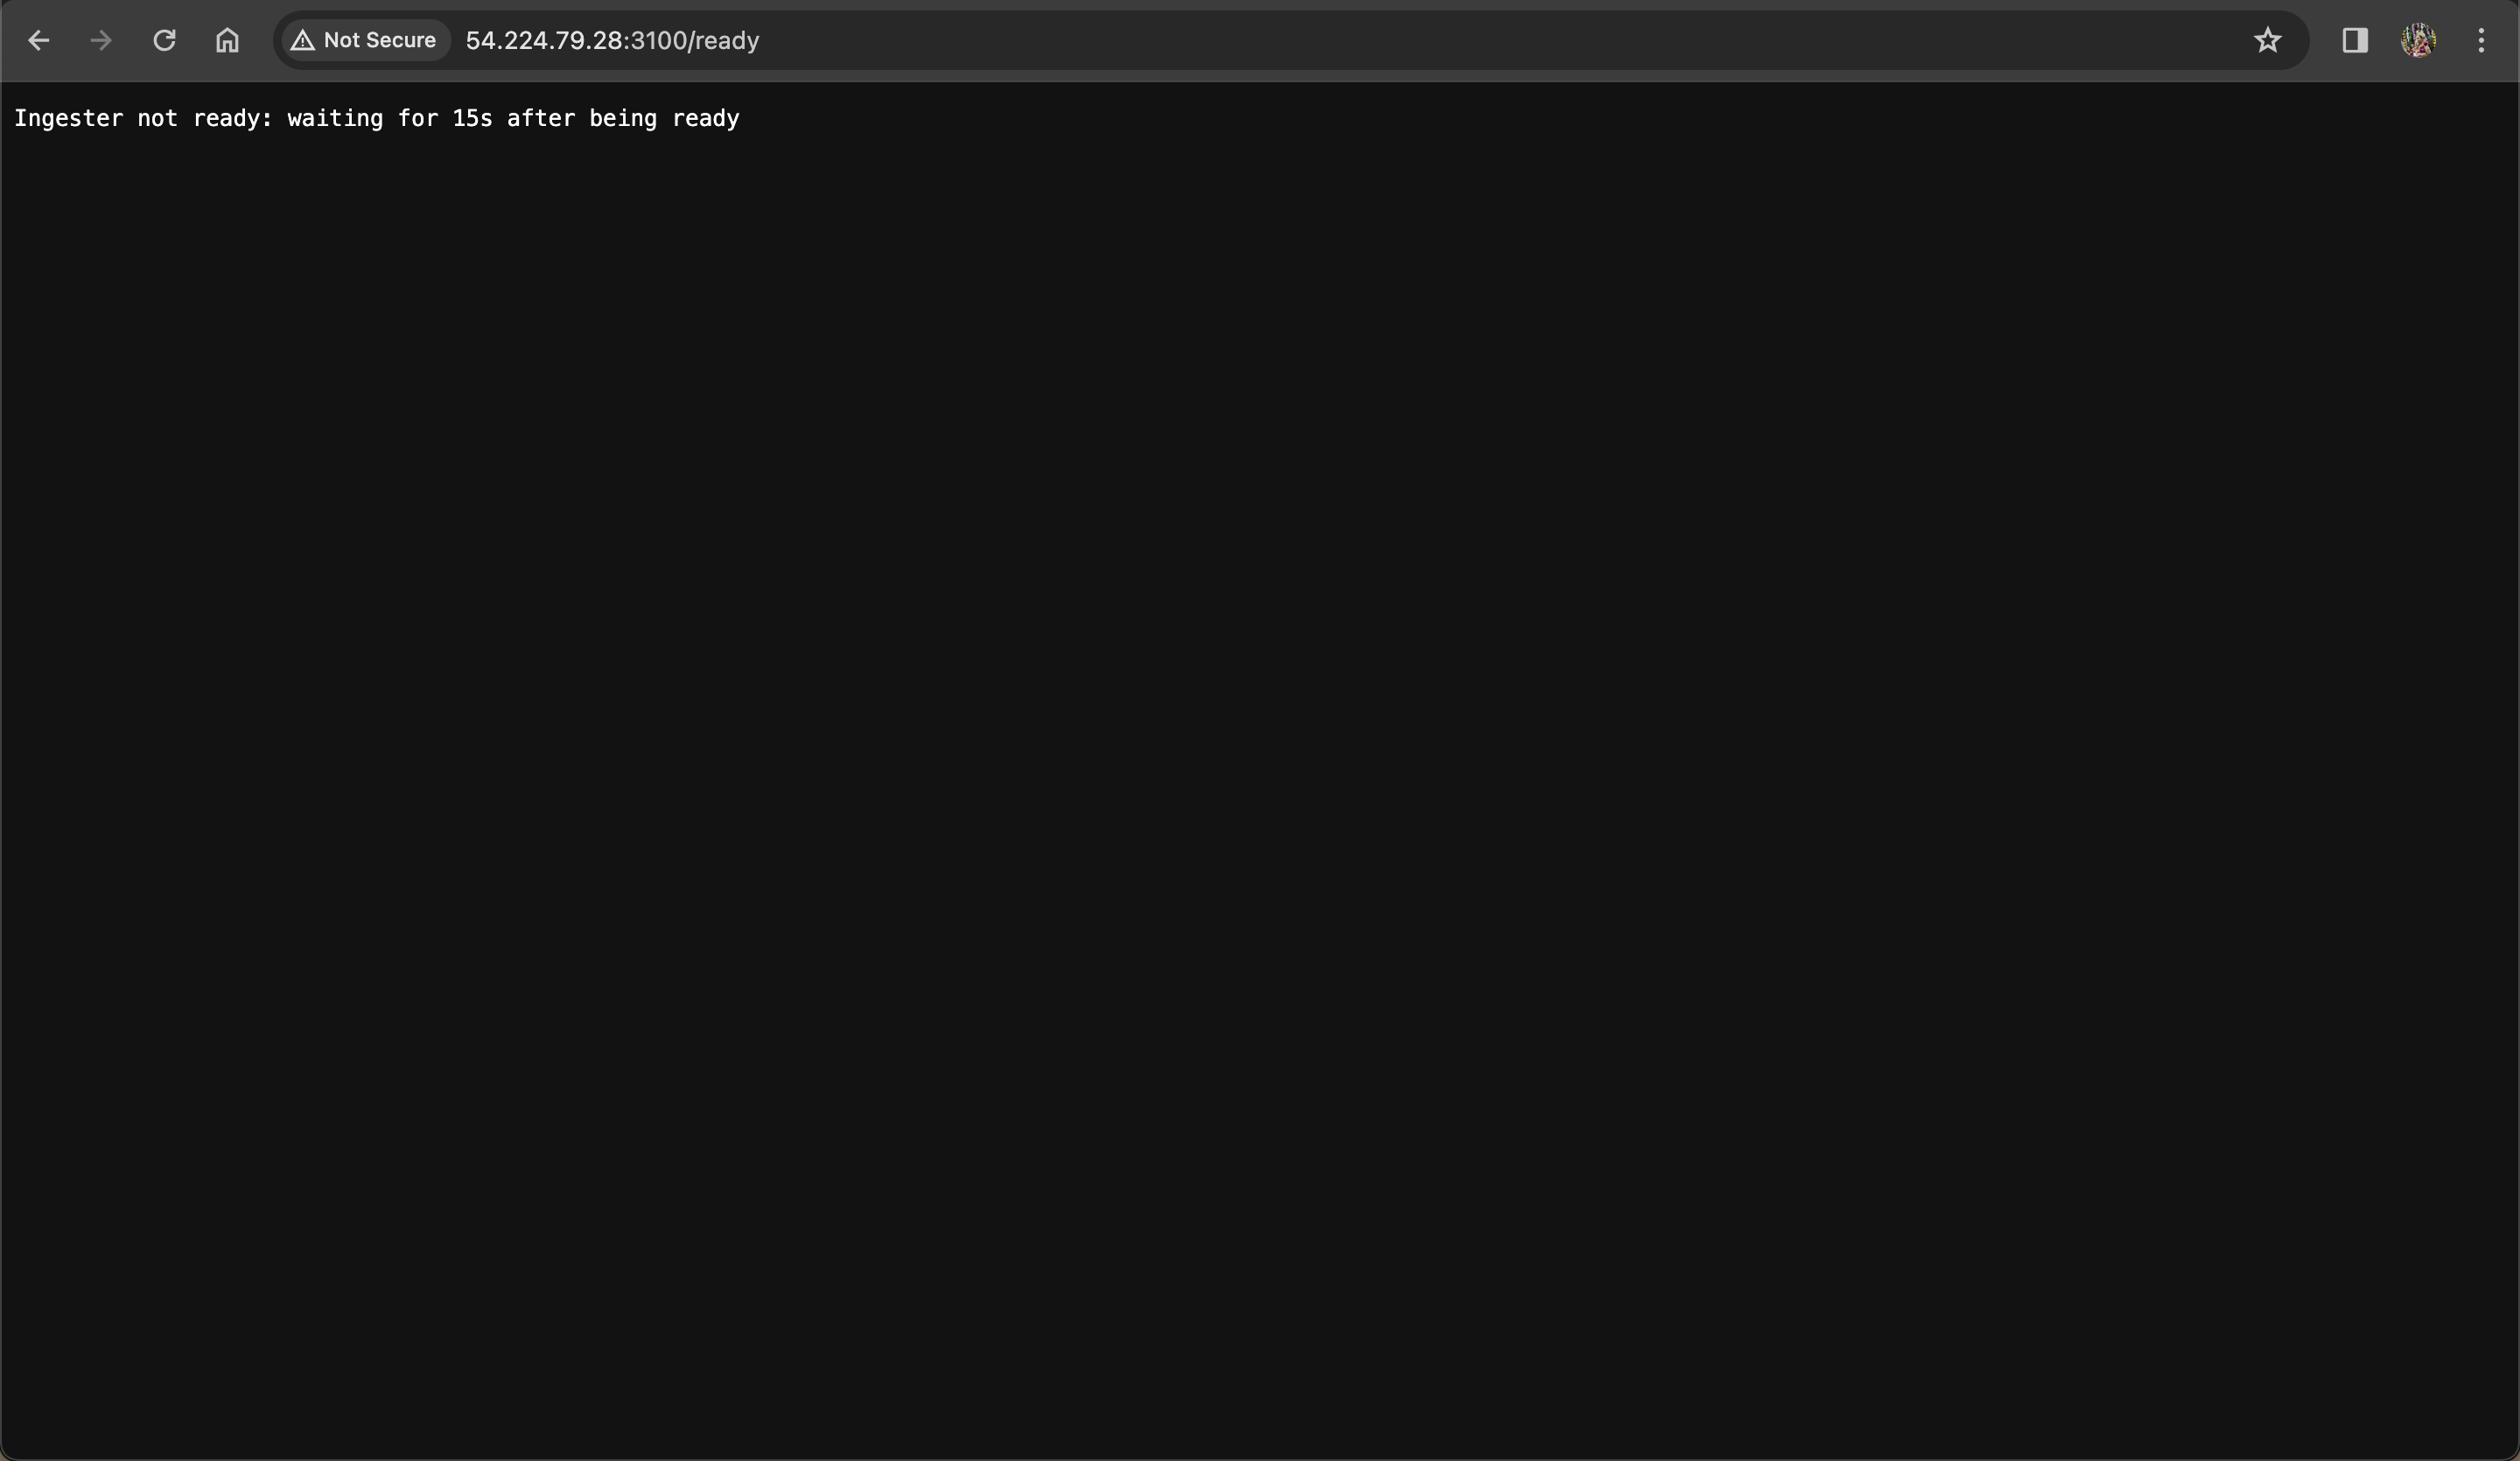
Wait for a while and retry.
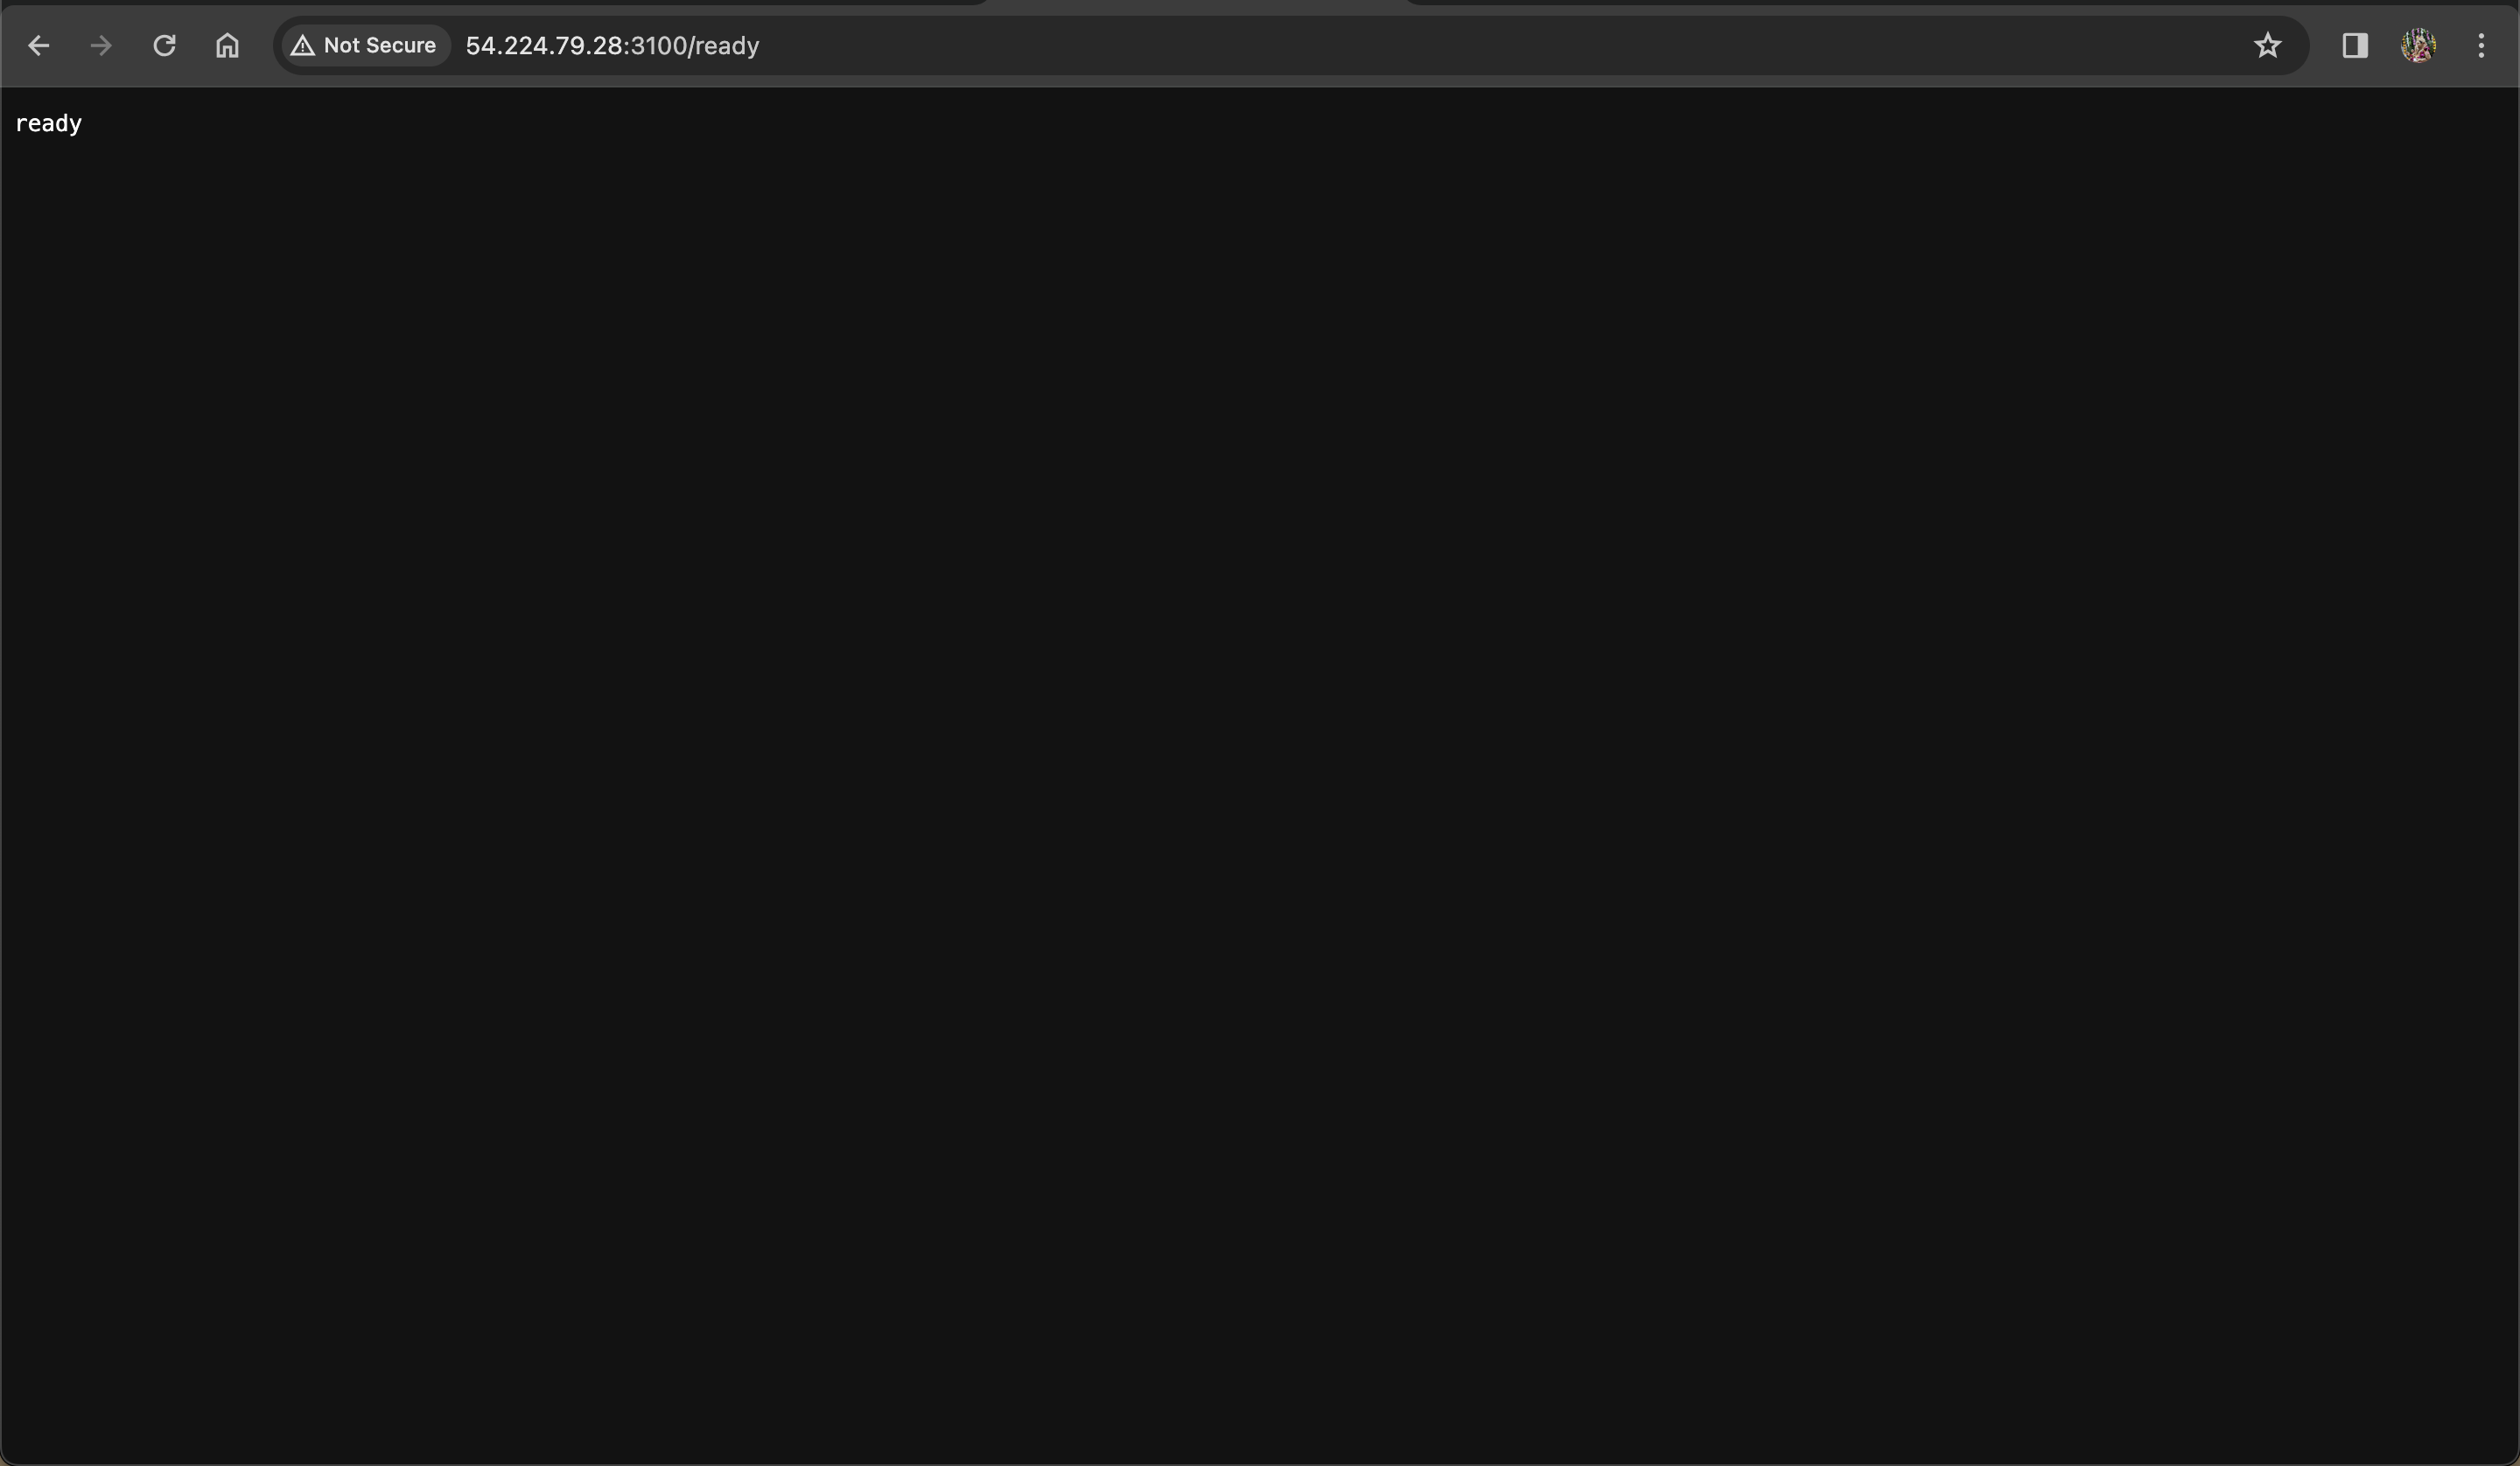
Done!
Step 5: Add data source
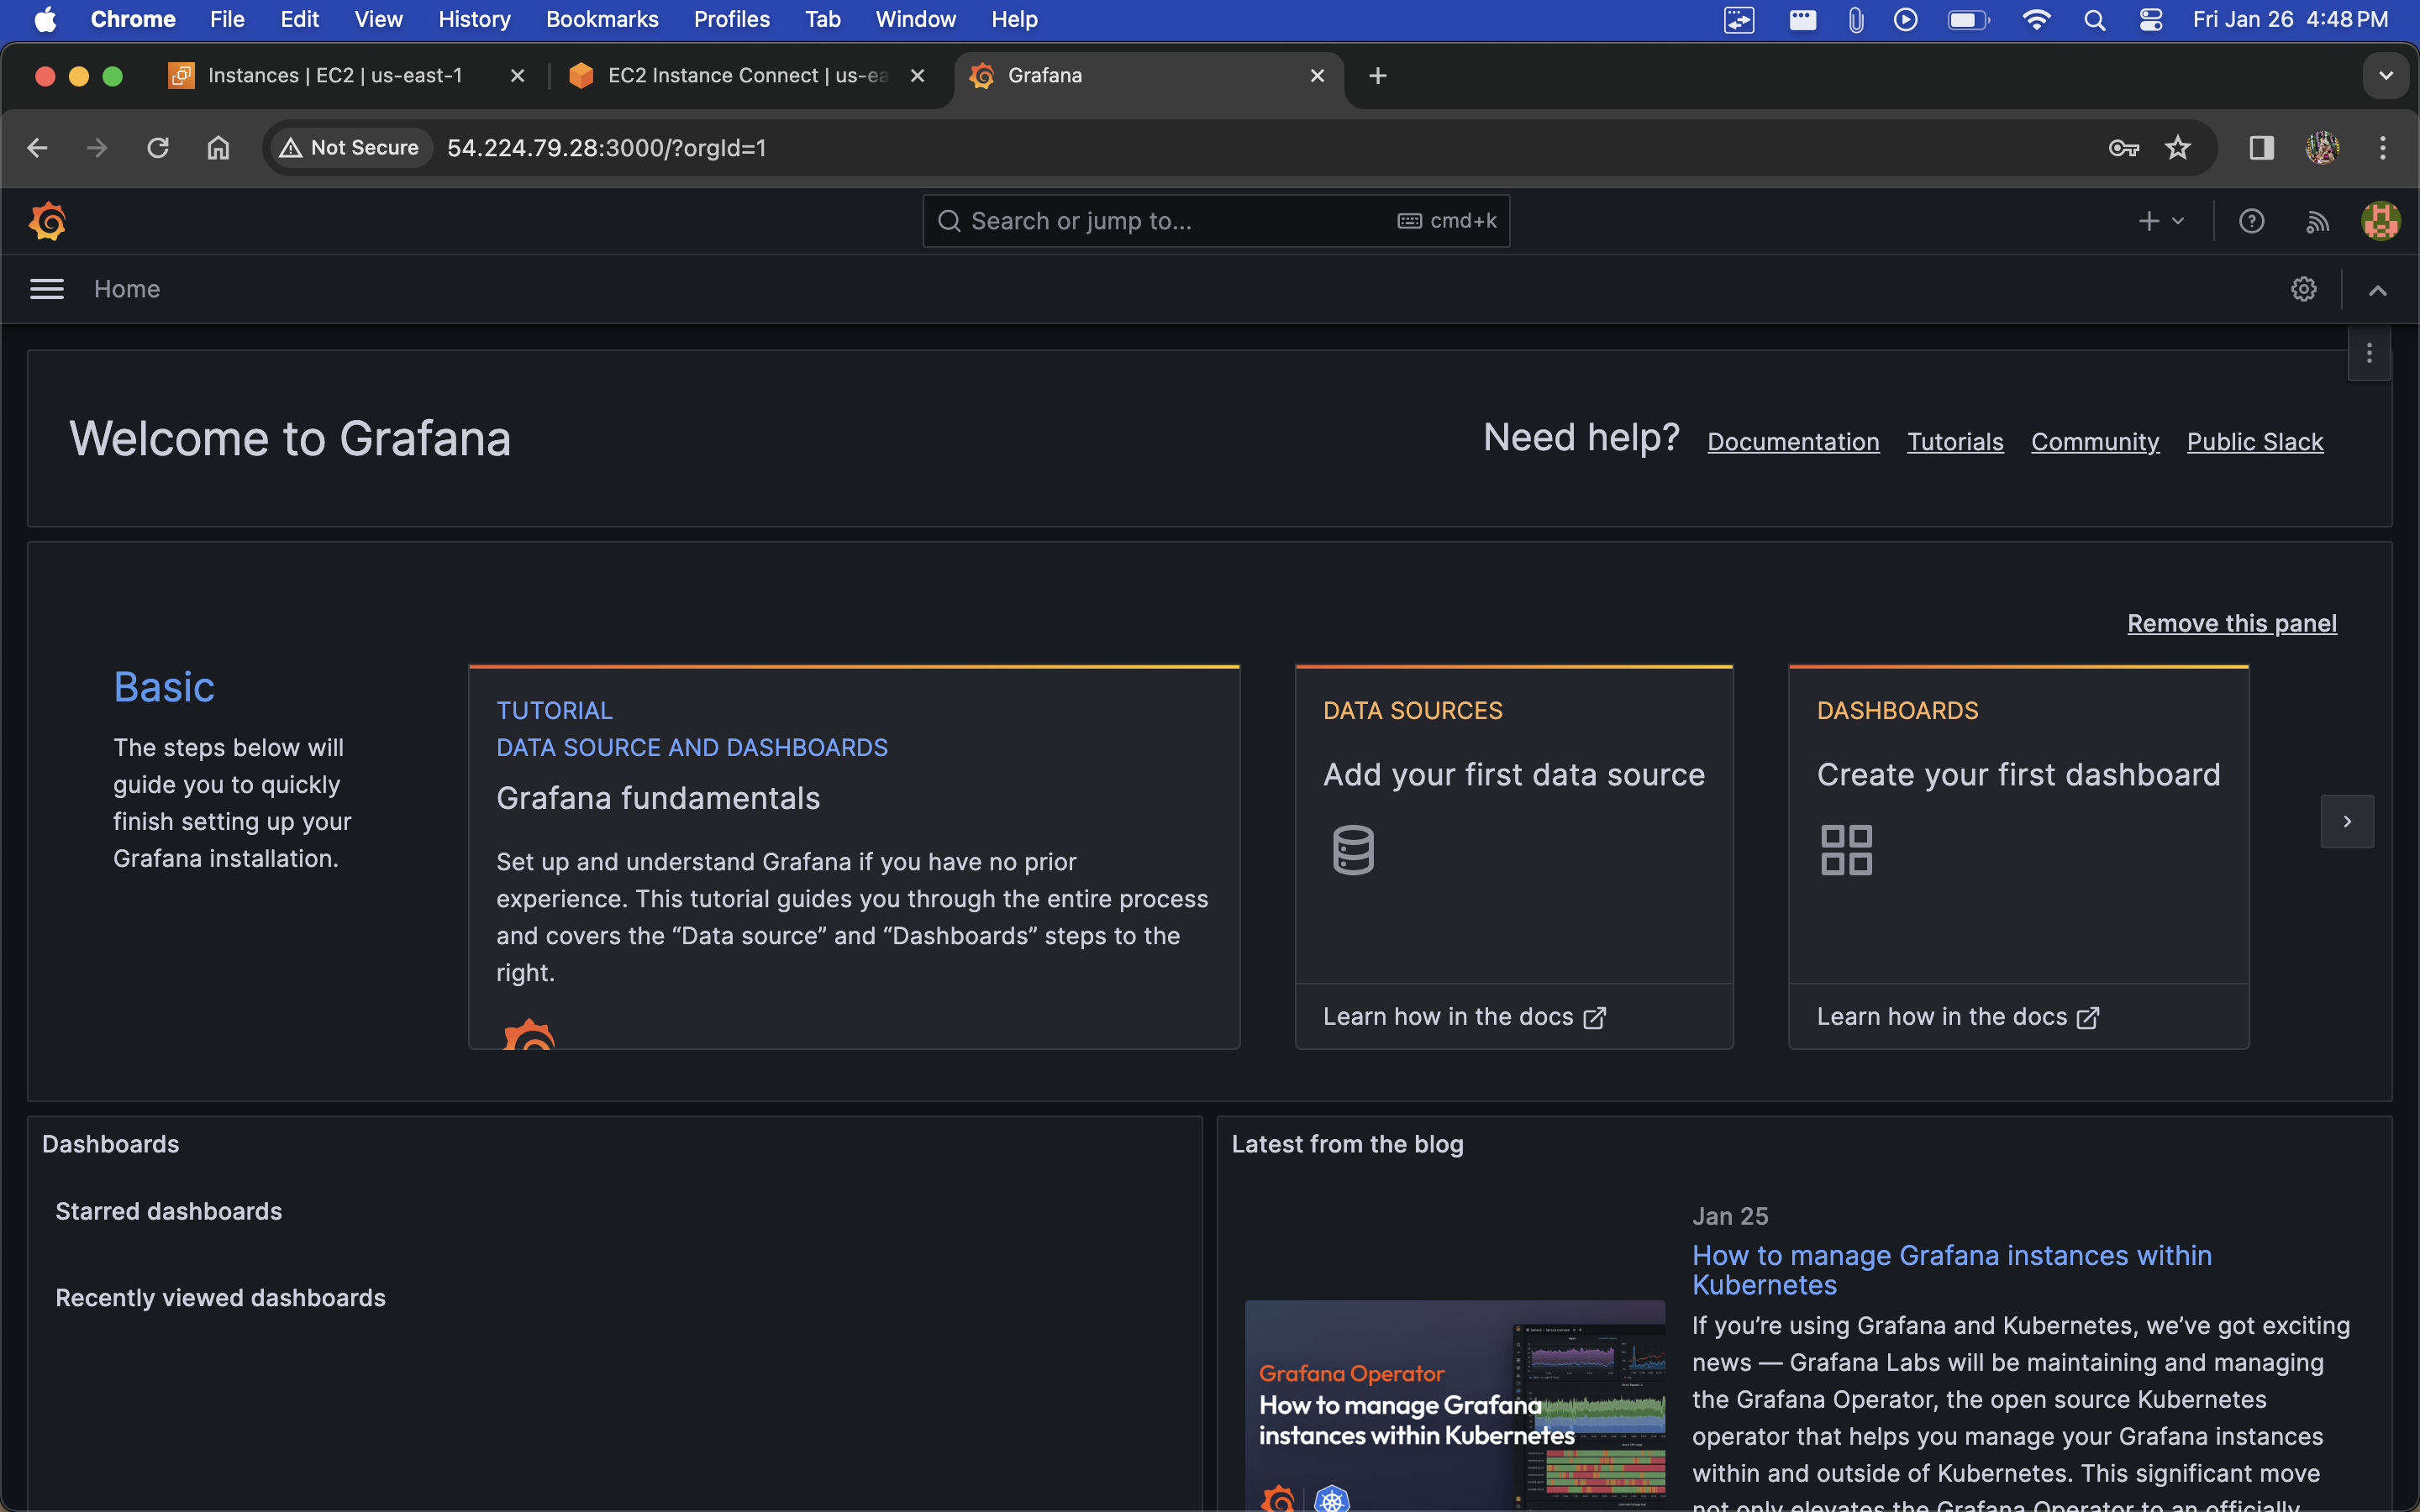
Visit url http://<ip>:3000 to access grafana portal.
Click on data sources.
Scroll down and find Loki, click on it.
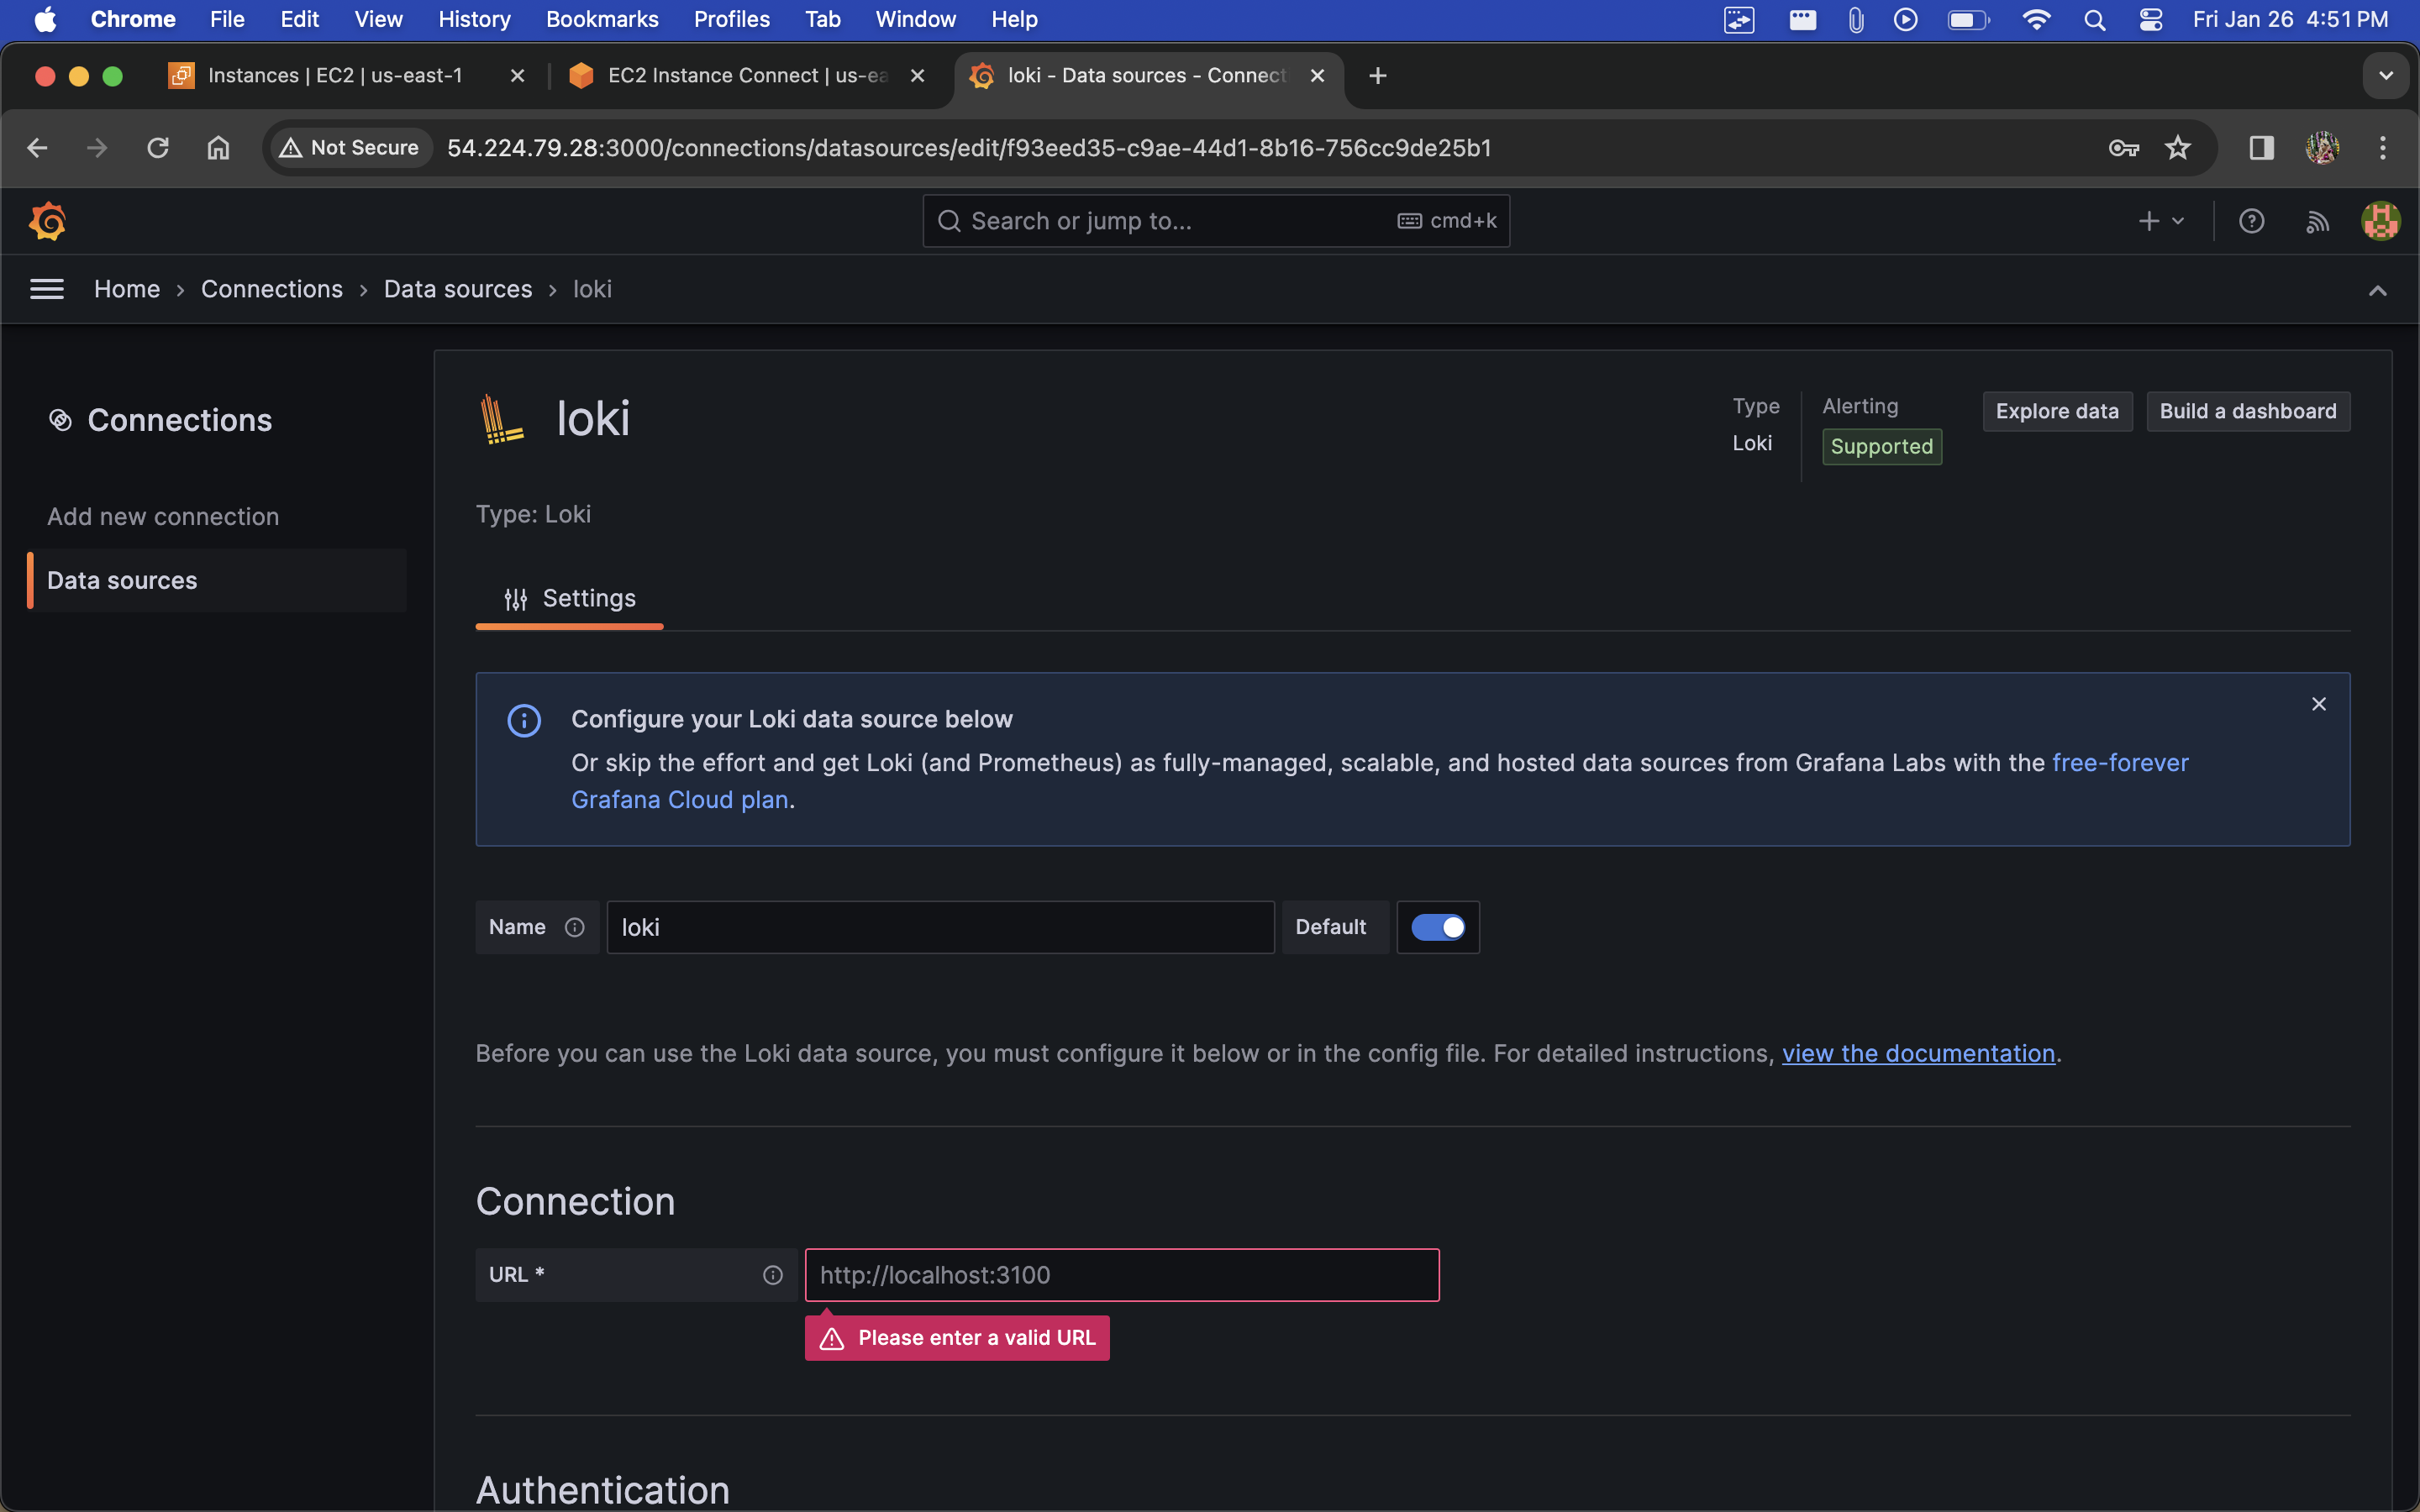
Add URL: http://localhost:3100 and click on save and test.

Data source successfully connected.
Your EC2 has connected and ready to share logs with the grafana.
Step 6: Acess Logs
Click on Explore view.
In label filters, choose select label as job and select value as varlogs
Click on Run Query.
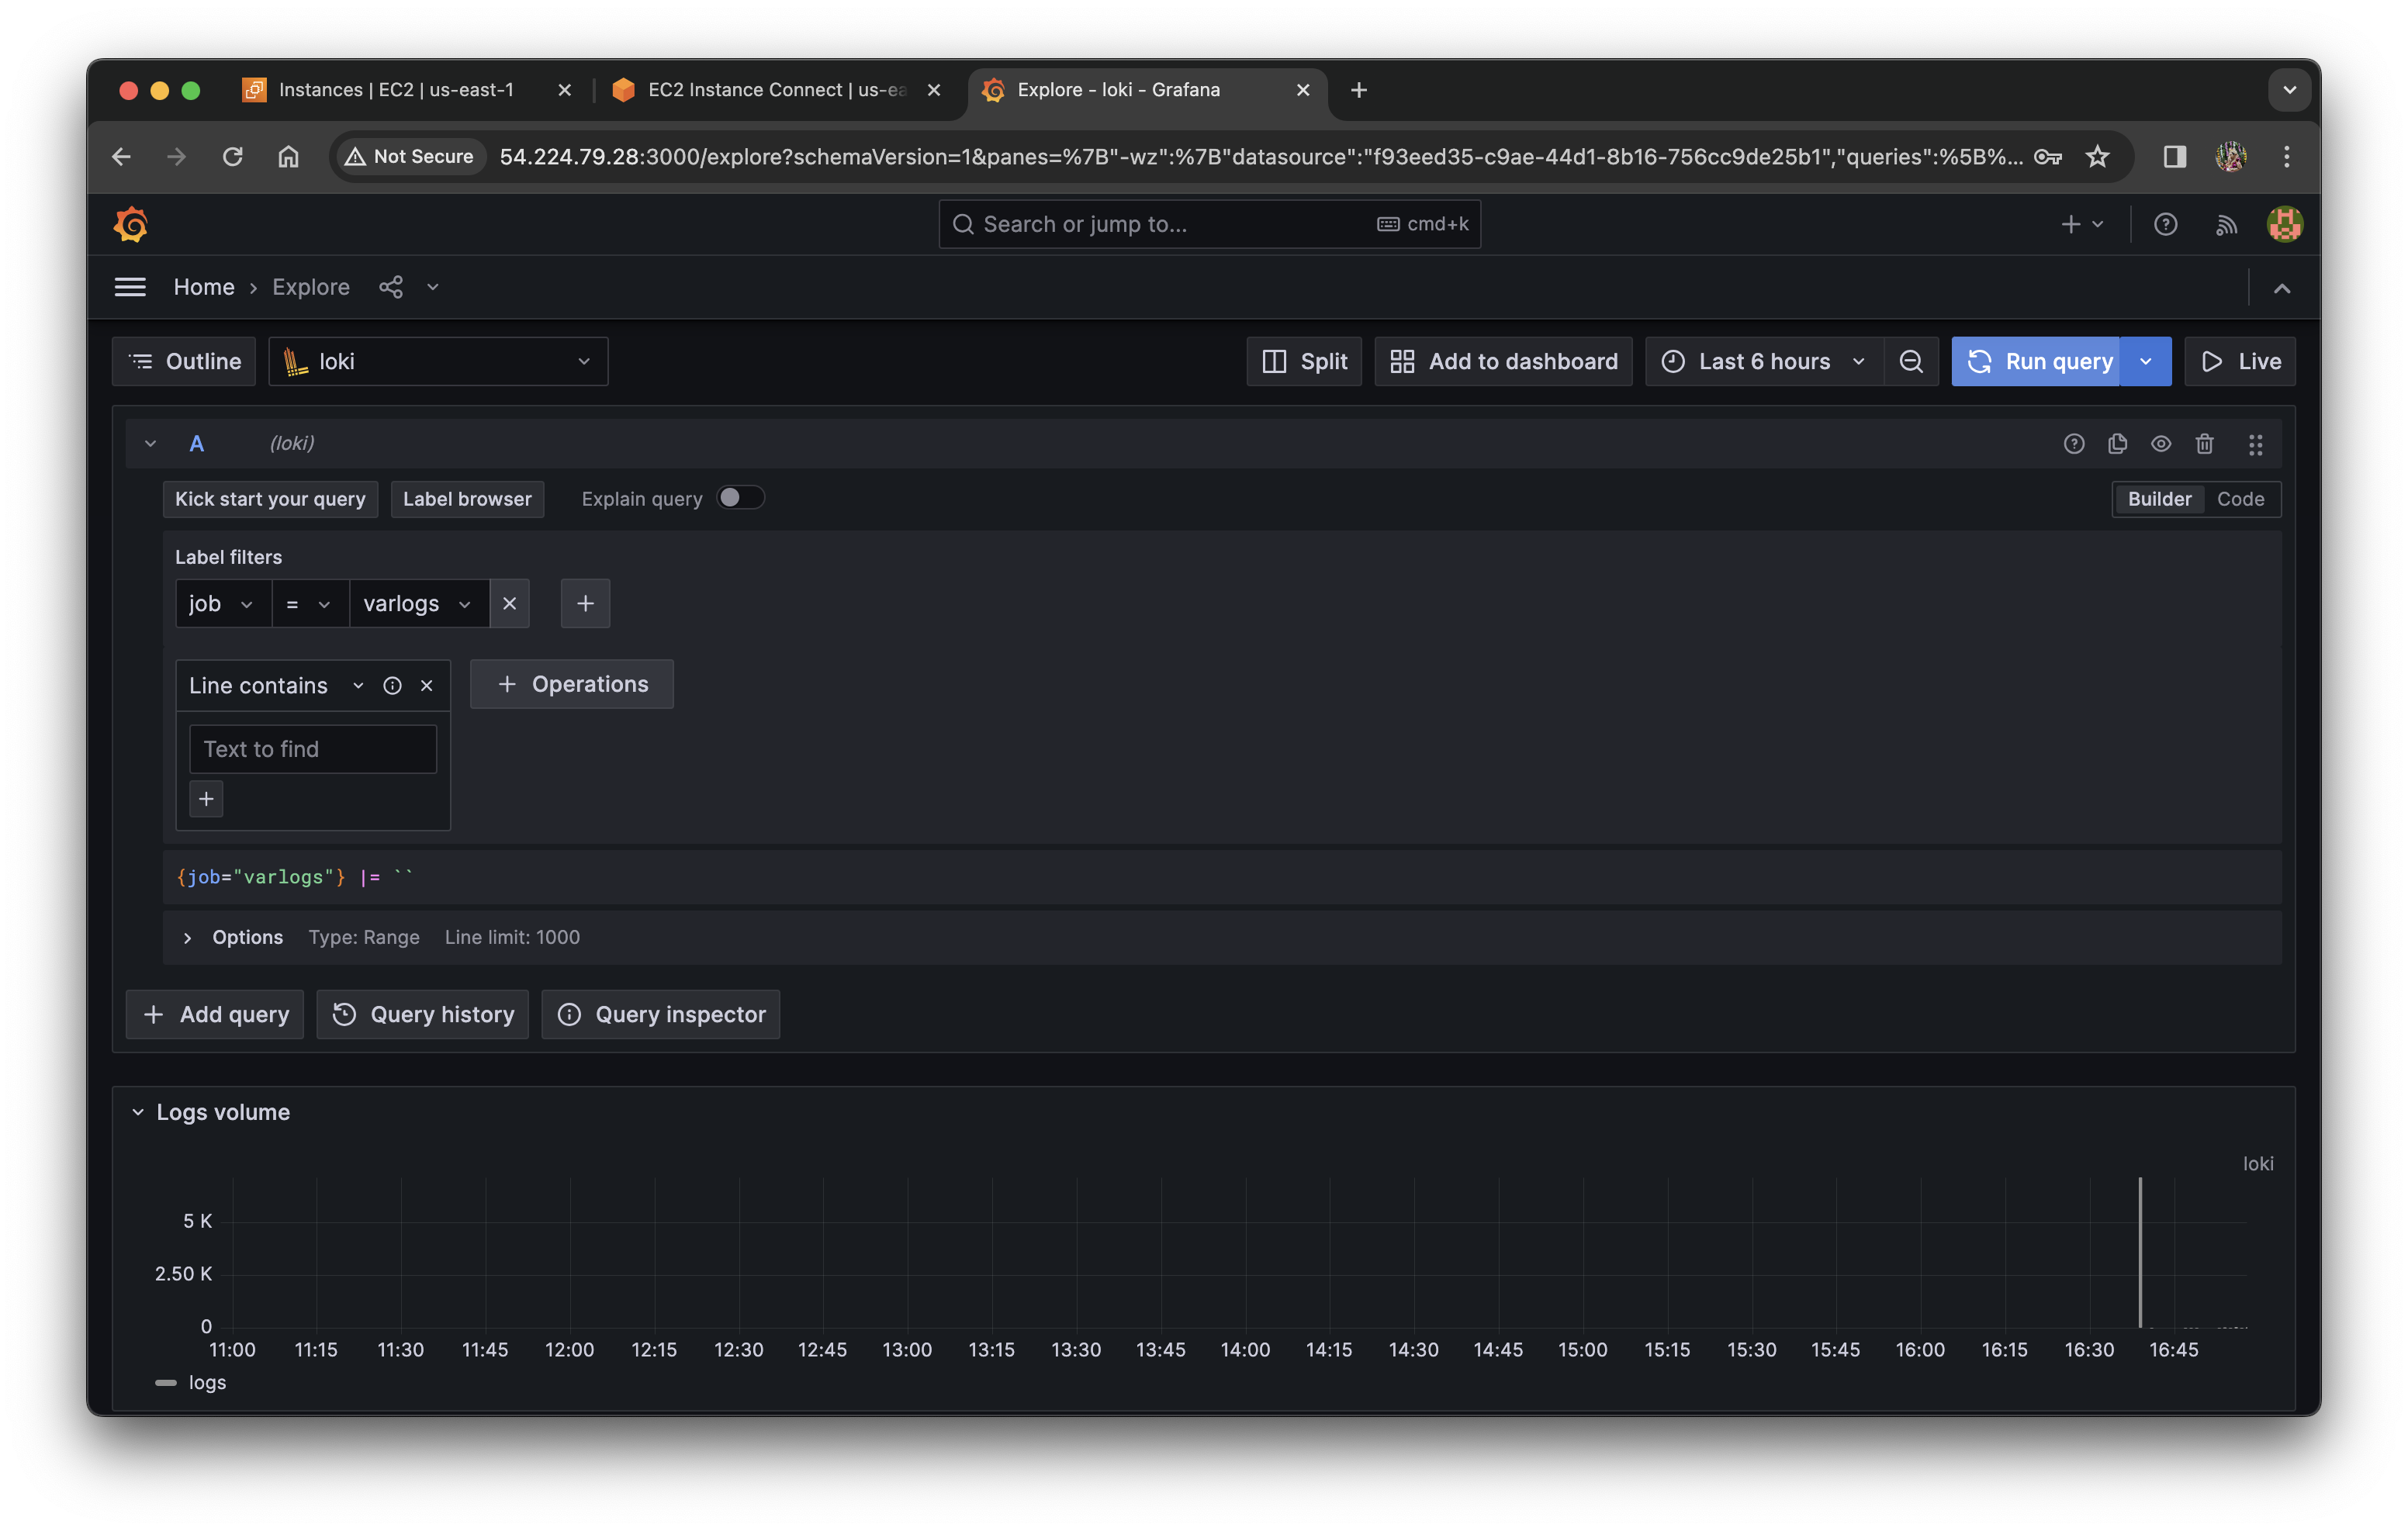
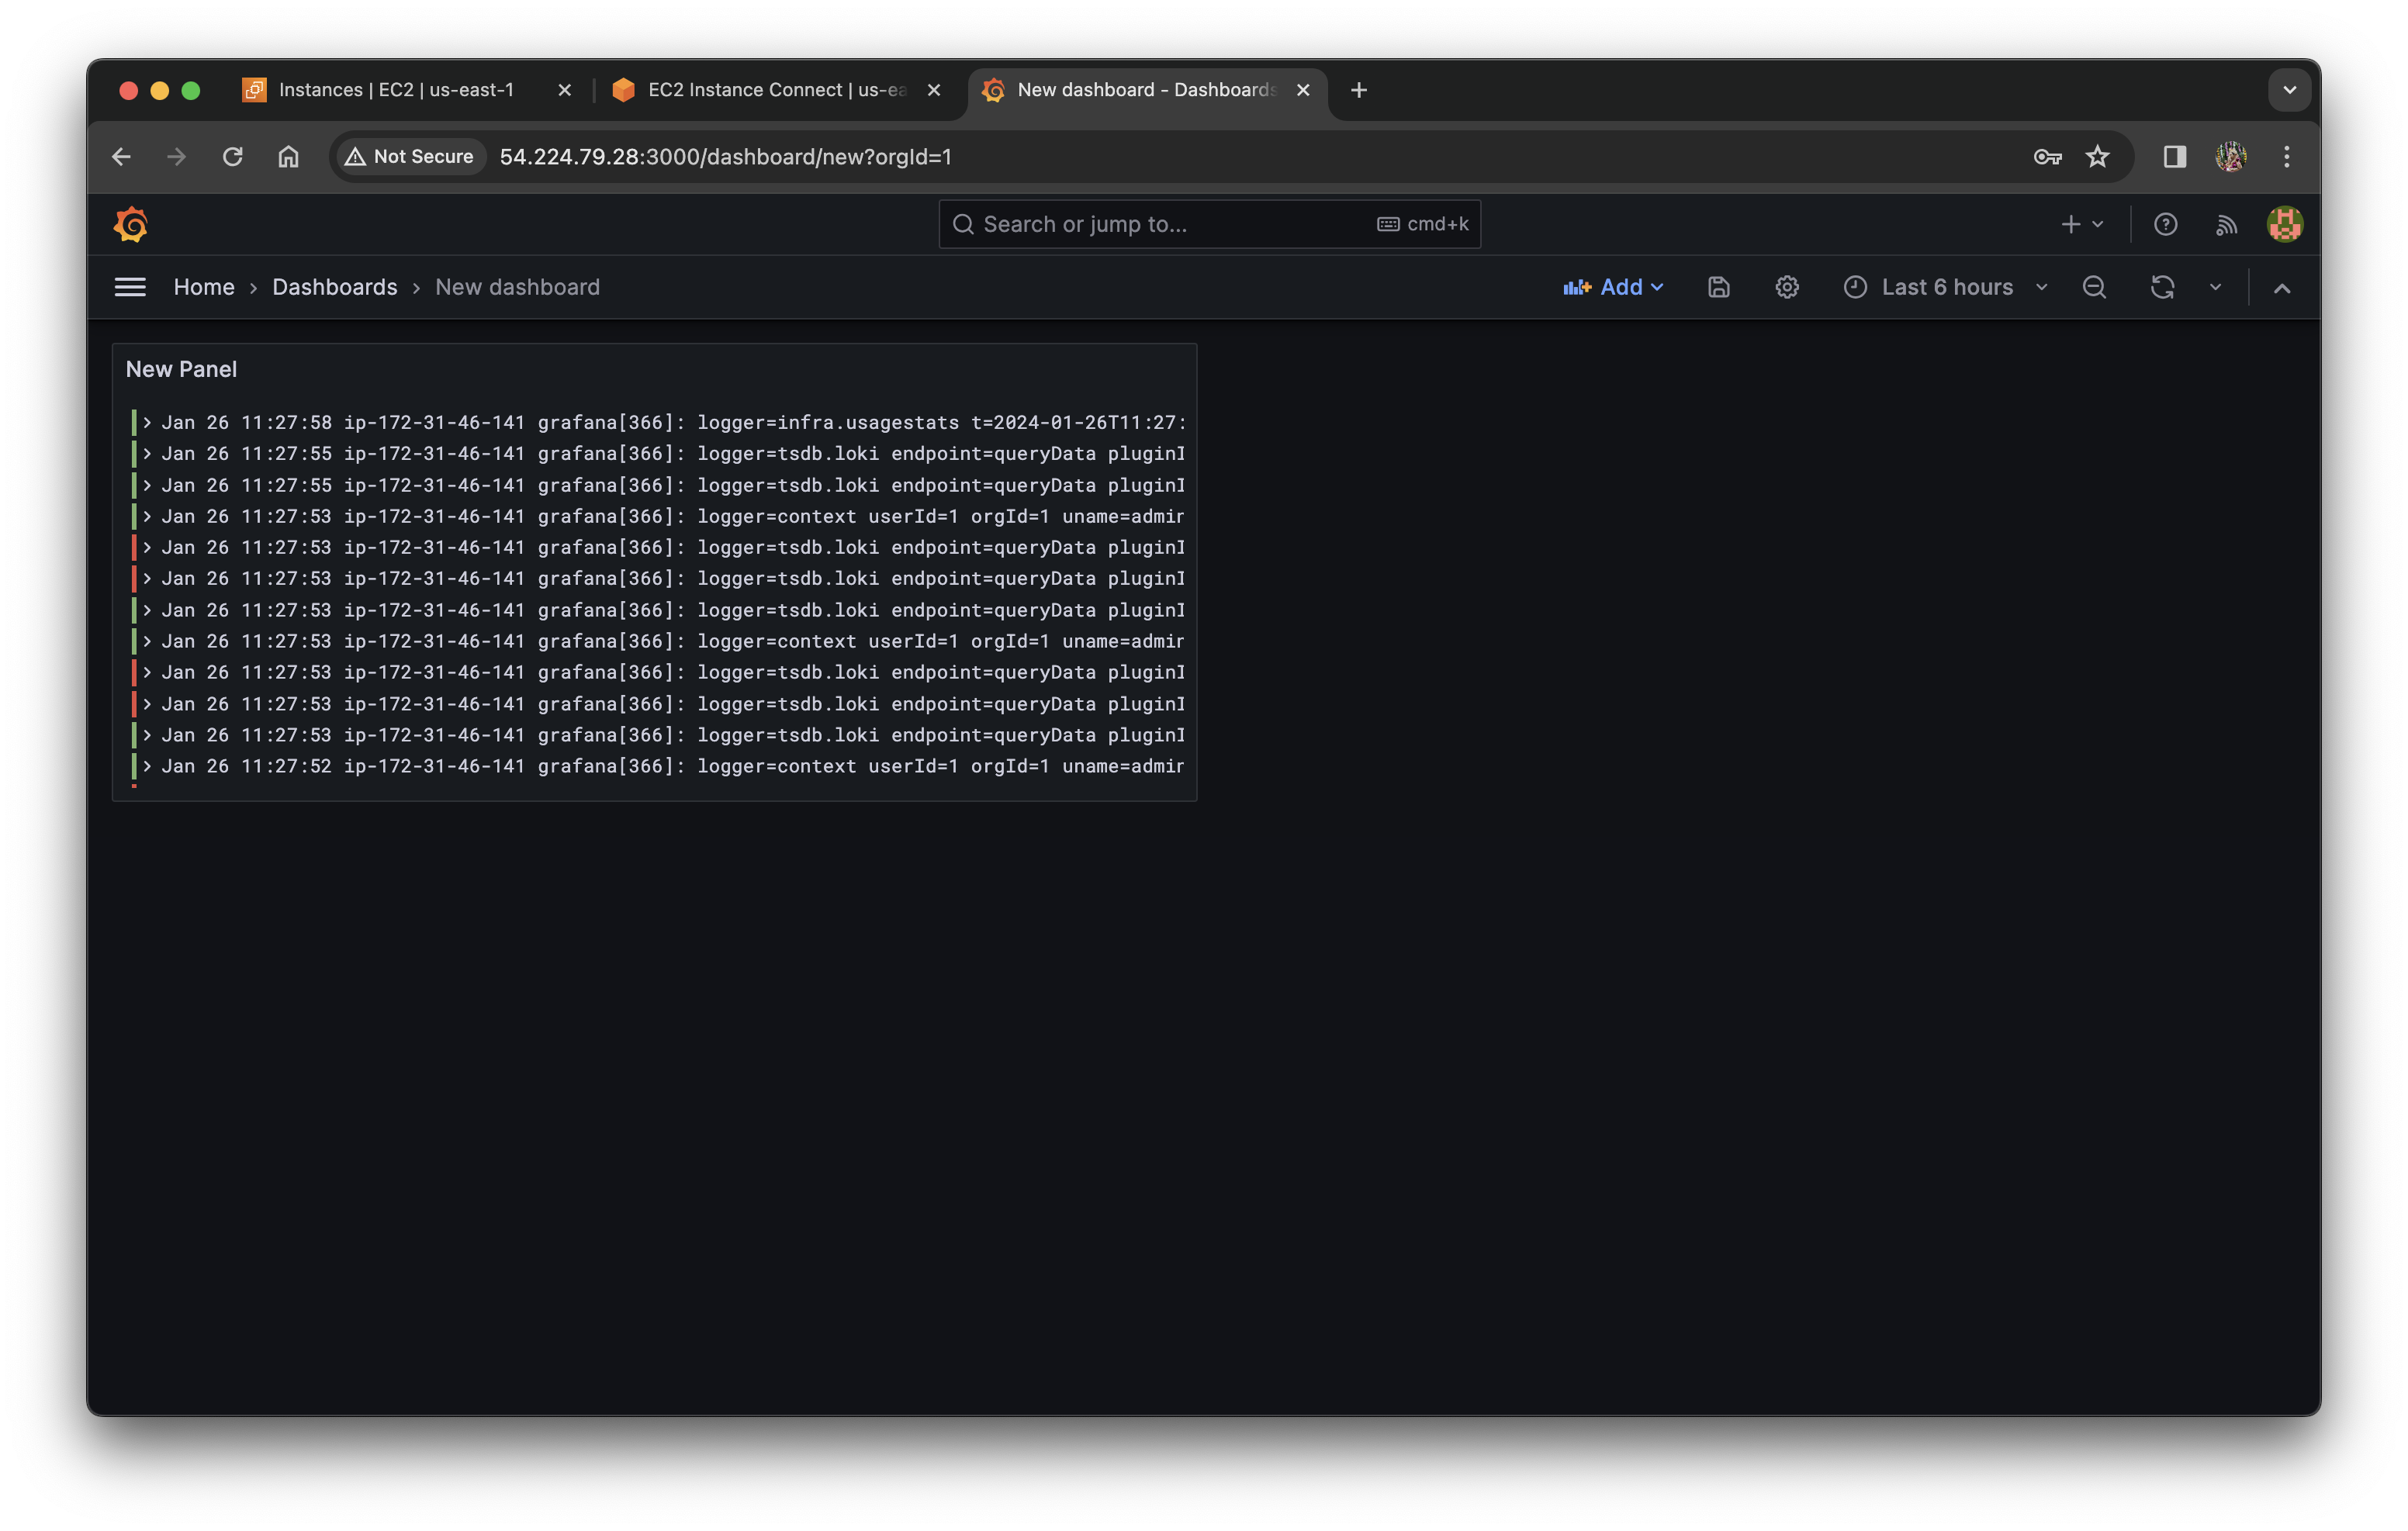
At the bottom you will find logs.

Click on Add to dashboard to display logs at dashboard.
Step 7: Custom Logs
To display the logs of your choise, add path to the promtail config file.
For example if you want to check the logs of Grafana the path is /var/log/grafana
The existing file is:

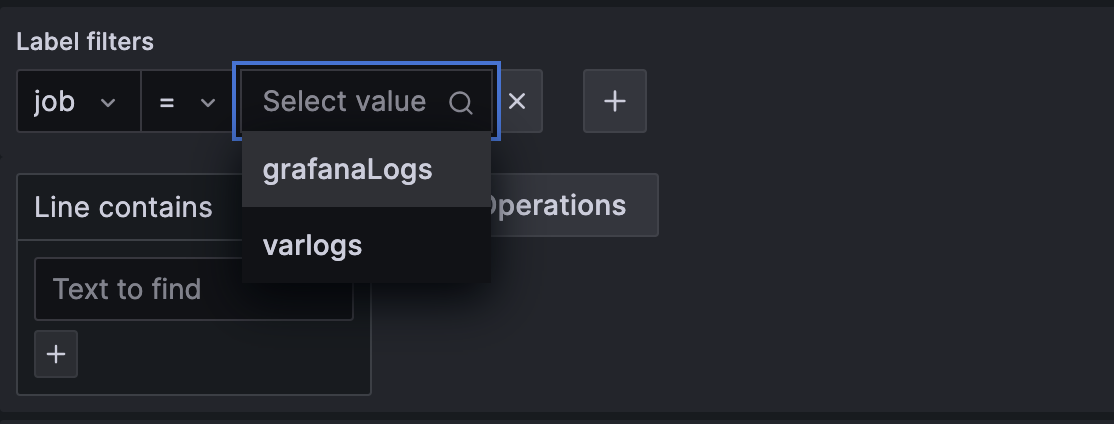
Add target for grafana.

Next restart the docker container for promtail.

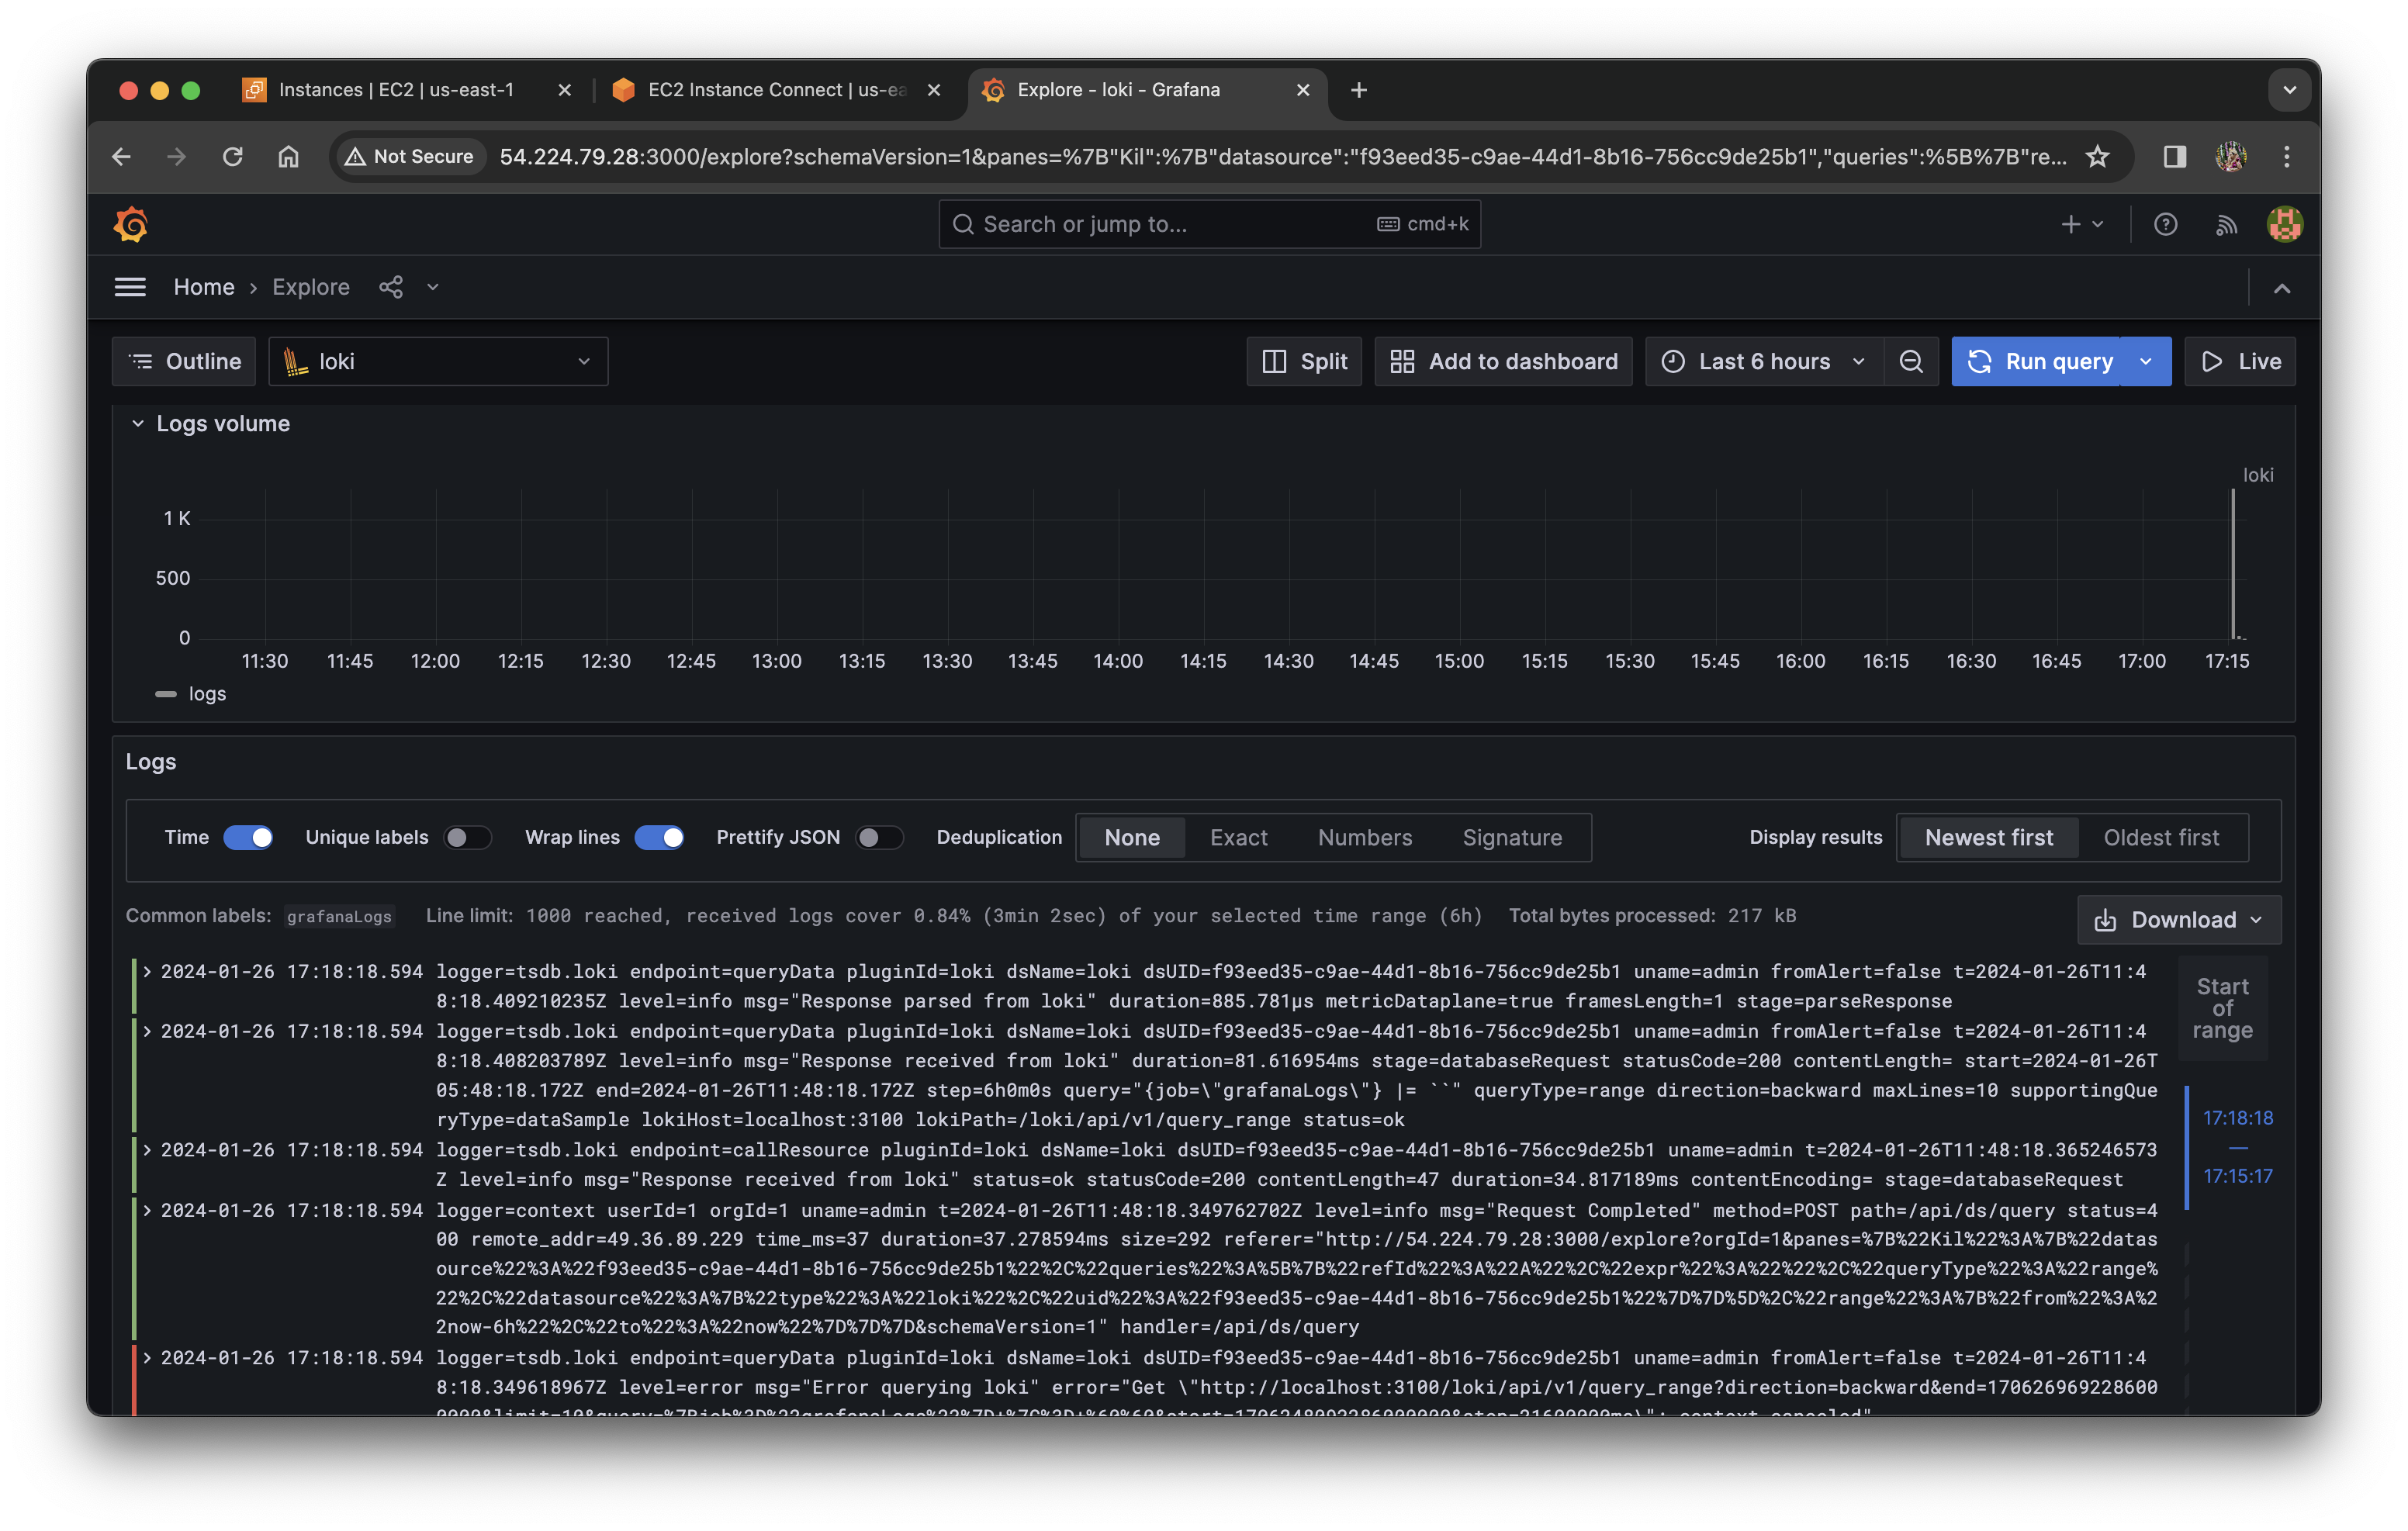
Now there will be a new option for grafanaLogs
Thanks for reading!


