Sending Docker Logs to Grafana

Day 75 of #90DaysOfDevOps
Sending Docker logs to Grafana requires a few tools such as:
Grafana
Docker, docker-compose [and some apps for to monitor]
Loki
Promtail
Prometheus
cAdvisor
What is Grafana?
- Grafana is an open-source, interactive data visualization platform that allows users to see their data through charts and graphs. It can be used for monitoring application performance.
What is Loki?
- Loki is a log aggregation system designed to store and query logs from all your applications and infrastructure.
What is Prometheus?
- Prometheus is an open-source monitoring and alerting toolkit for microservices and containers. It provides real-time notifications and flexible queries. Prometheus can also collect and store metrics as time-series data, recording information with a timestamp.
What is Promtail?
- Promtail is an agent which ships the contents of local logs to a private Grafana Loki instance or Grafana Cloud. It is usually deployed to every machine that runs applications which need to be monitored. It primarily discovers targets.
What is cAdvisor?
- cAdvisor, short for Container Advisor, is an open-source tool that monitors containers. It collects, processes, and exports container-based metrics such as CPU and memory usage, filesystem and network statistics.
Step #1: Install and configure Grafana, Docker, Loki and Promtail
To install and configure Grafana, Docker, Loki and Promtail refer to my previous blog: https://neel-soni.hashnode.dev/connecting-ec2-with-grafana You will find detailed explanations step by step.
OR
You can simply run the grafana-install.sh file from my github repository: https://github.com/neelsoni26/install-grafana-loki-promtail
After that come back here and continue.
Step #1: Install and configure Prometheus and cAdvisor
Now, it is time to install and configure Prometheus.
Create a folder prometheus and inside it downlaod the configuration file with the command:
wget https://raw.githubusercontent.com/prometheus/prometheus/main/documentation/examples/prometheus.yml
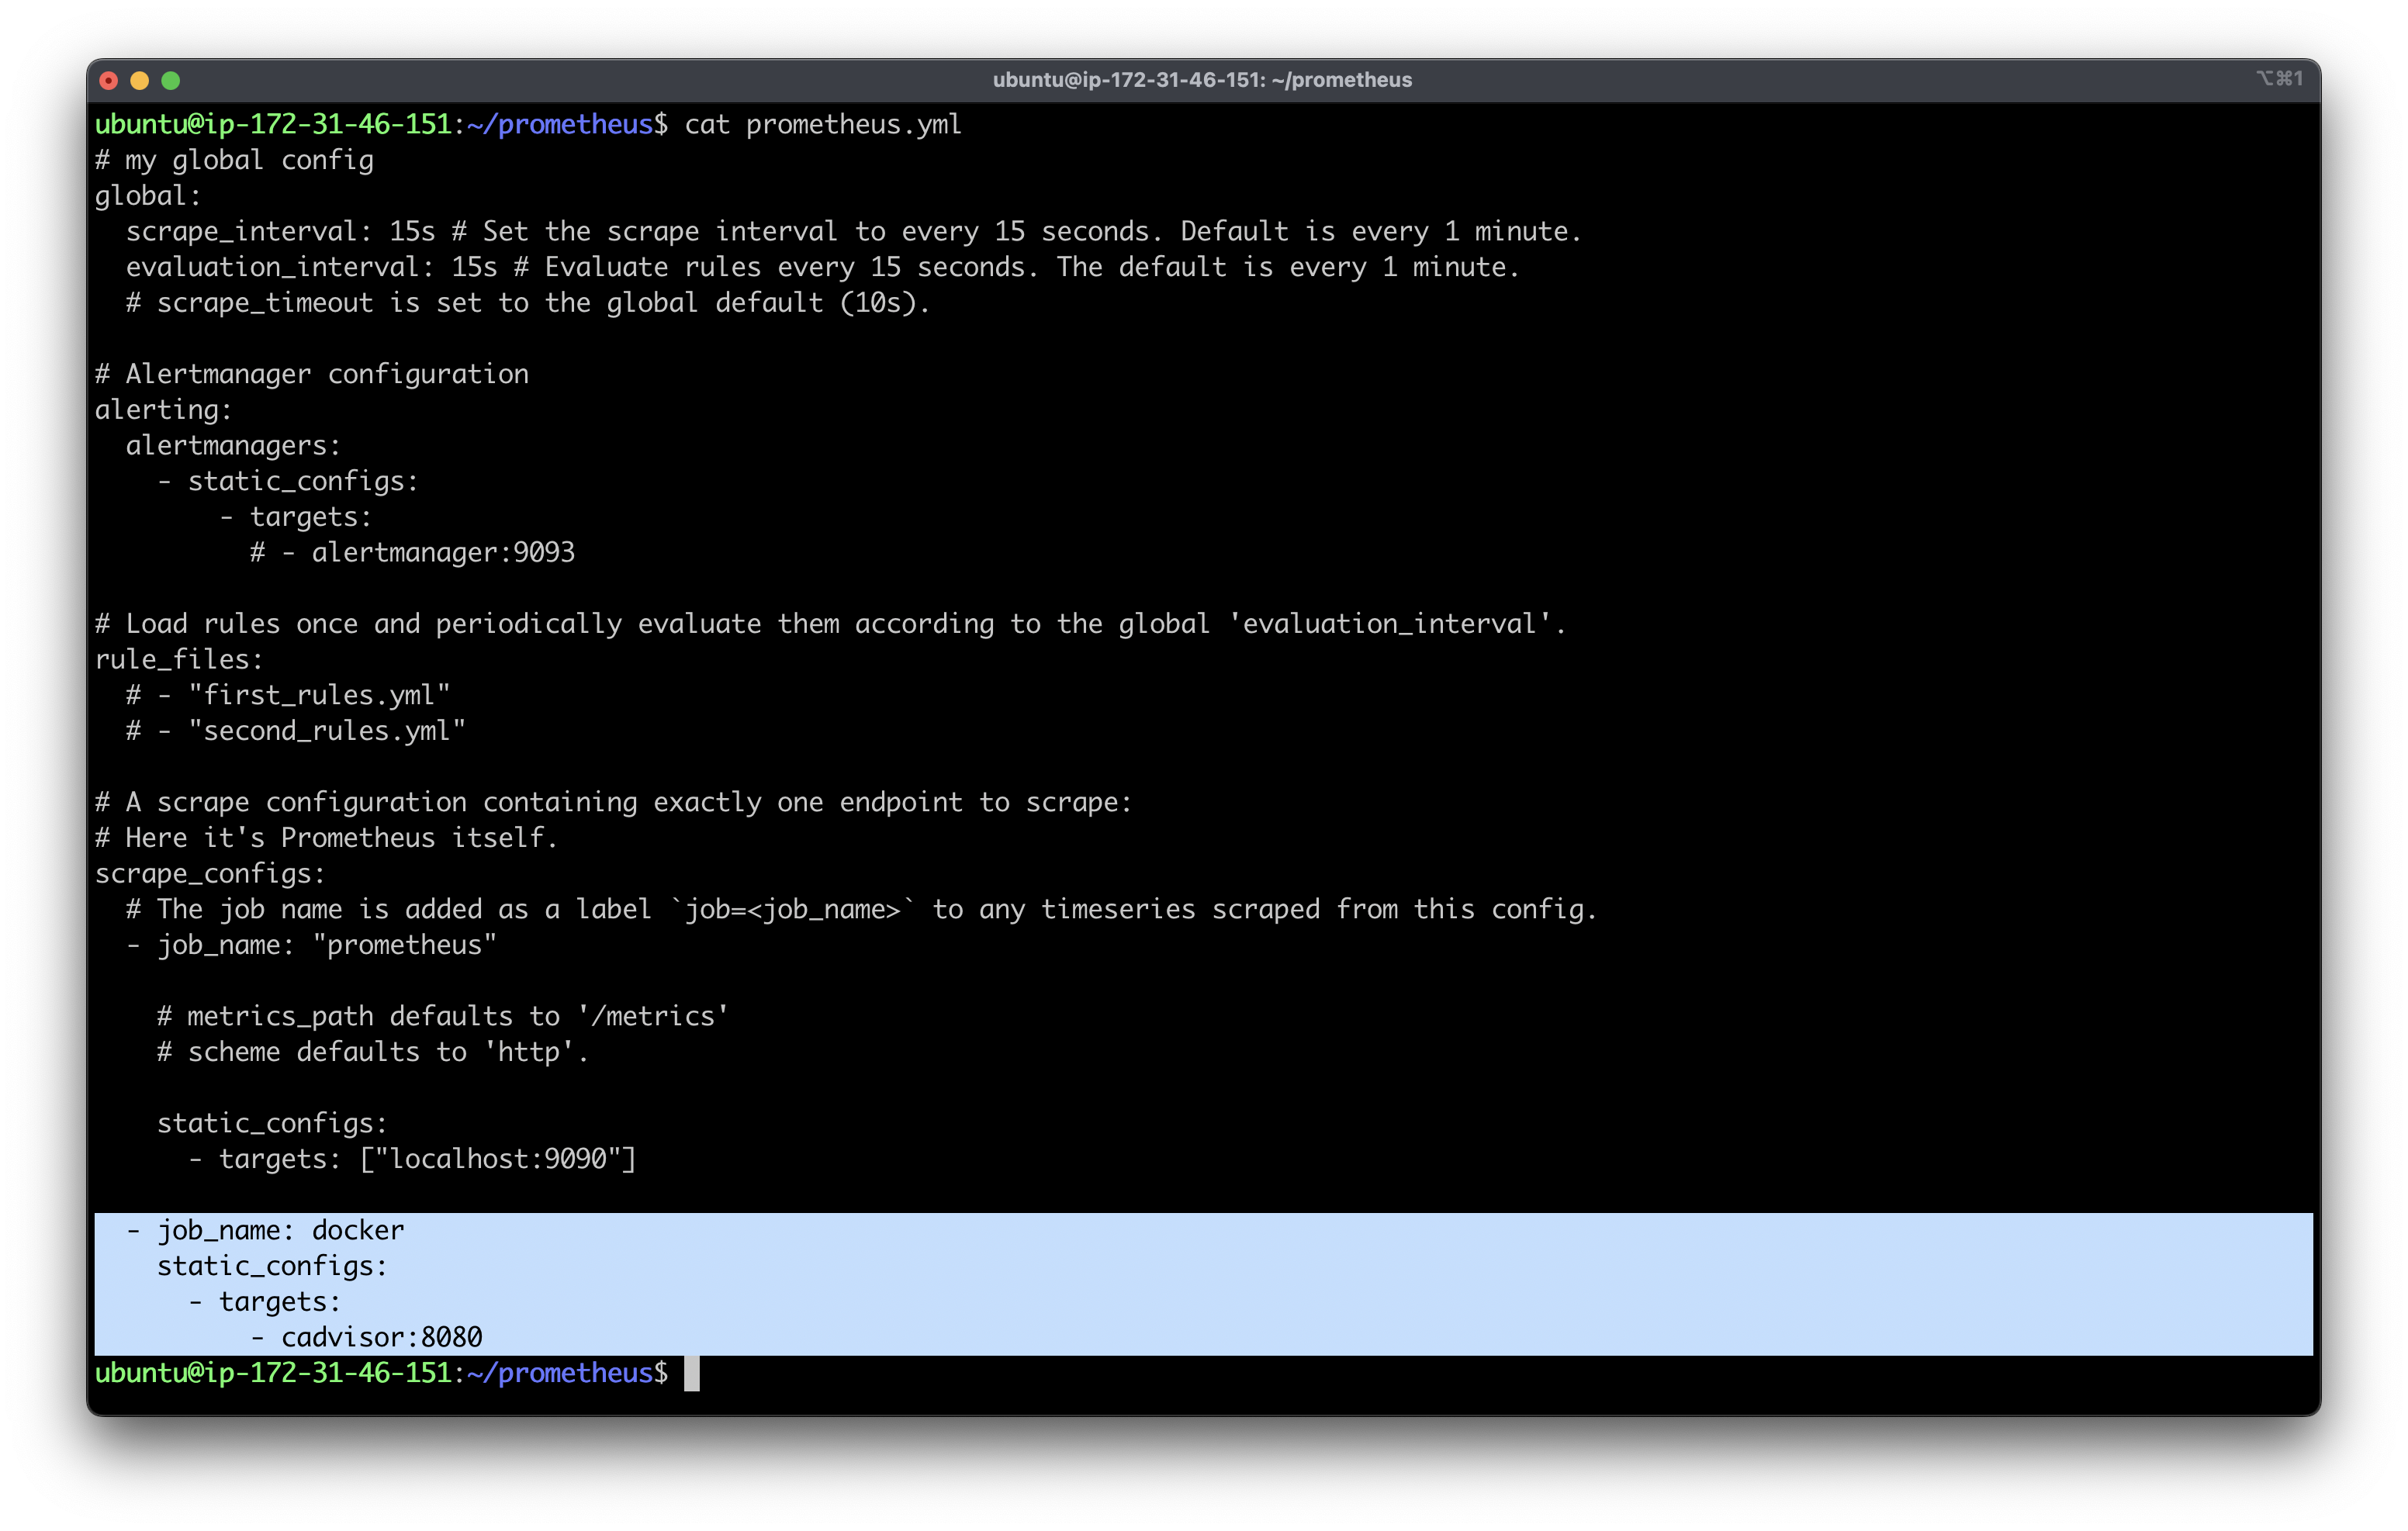
Modify this file and add below content in the scrape_configs section.
- job_name: cadvisor
  static_configs:
  - targets:
    - cadvisor:8080
Next, create a docker compose file and paste the below content in it.
version: '3.2'
services:
  prometheus:
    image: prom/prometheus:latest
    container_name: prometheus
    ports:
    - 9090:9090
    command:
    - --config.file=/etc/prometheus/prometheus.yml
    volumes:
    - ./prometheus.yml:/etc/prometheus/prometheus.yml:ro
    depends_on:
    - cadvisor
  cadvisor:
    image: gcr.io/cadvisor/cadvisor:latest
    container_name: cadvisor
    ports:
    - 8080:8080
    volumes:
    - /:/rootfs:ro
    - /var/run:/var/run:rw
    - /sys:/sys:ro
    - /var/lib/docker/:/var/lib/docker:ro
    depends_on:
    - redis
  redis:
    image: redis:latest
    container_name: redis
    ports:
    - 6379:6379
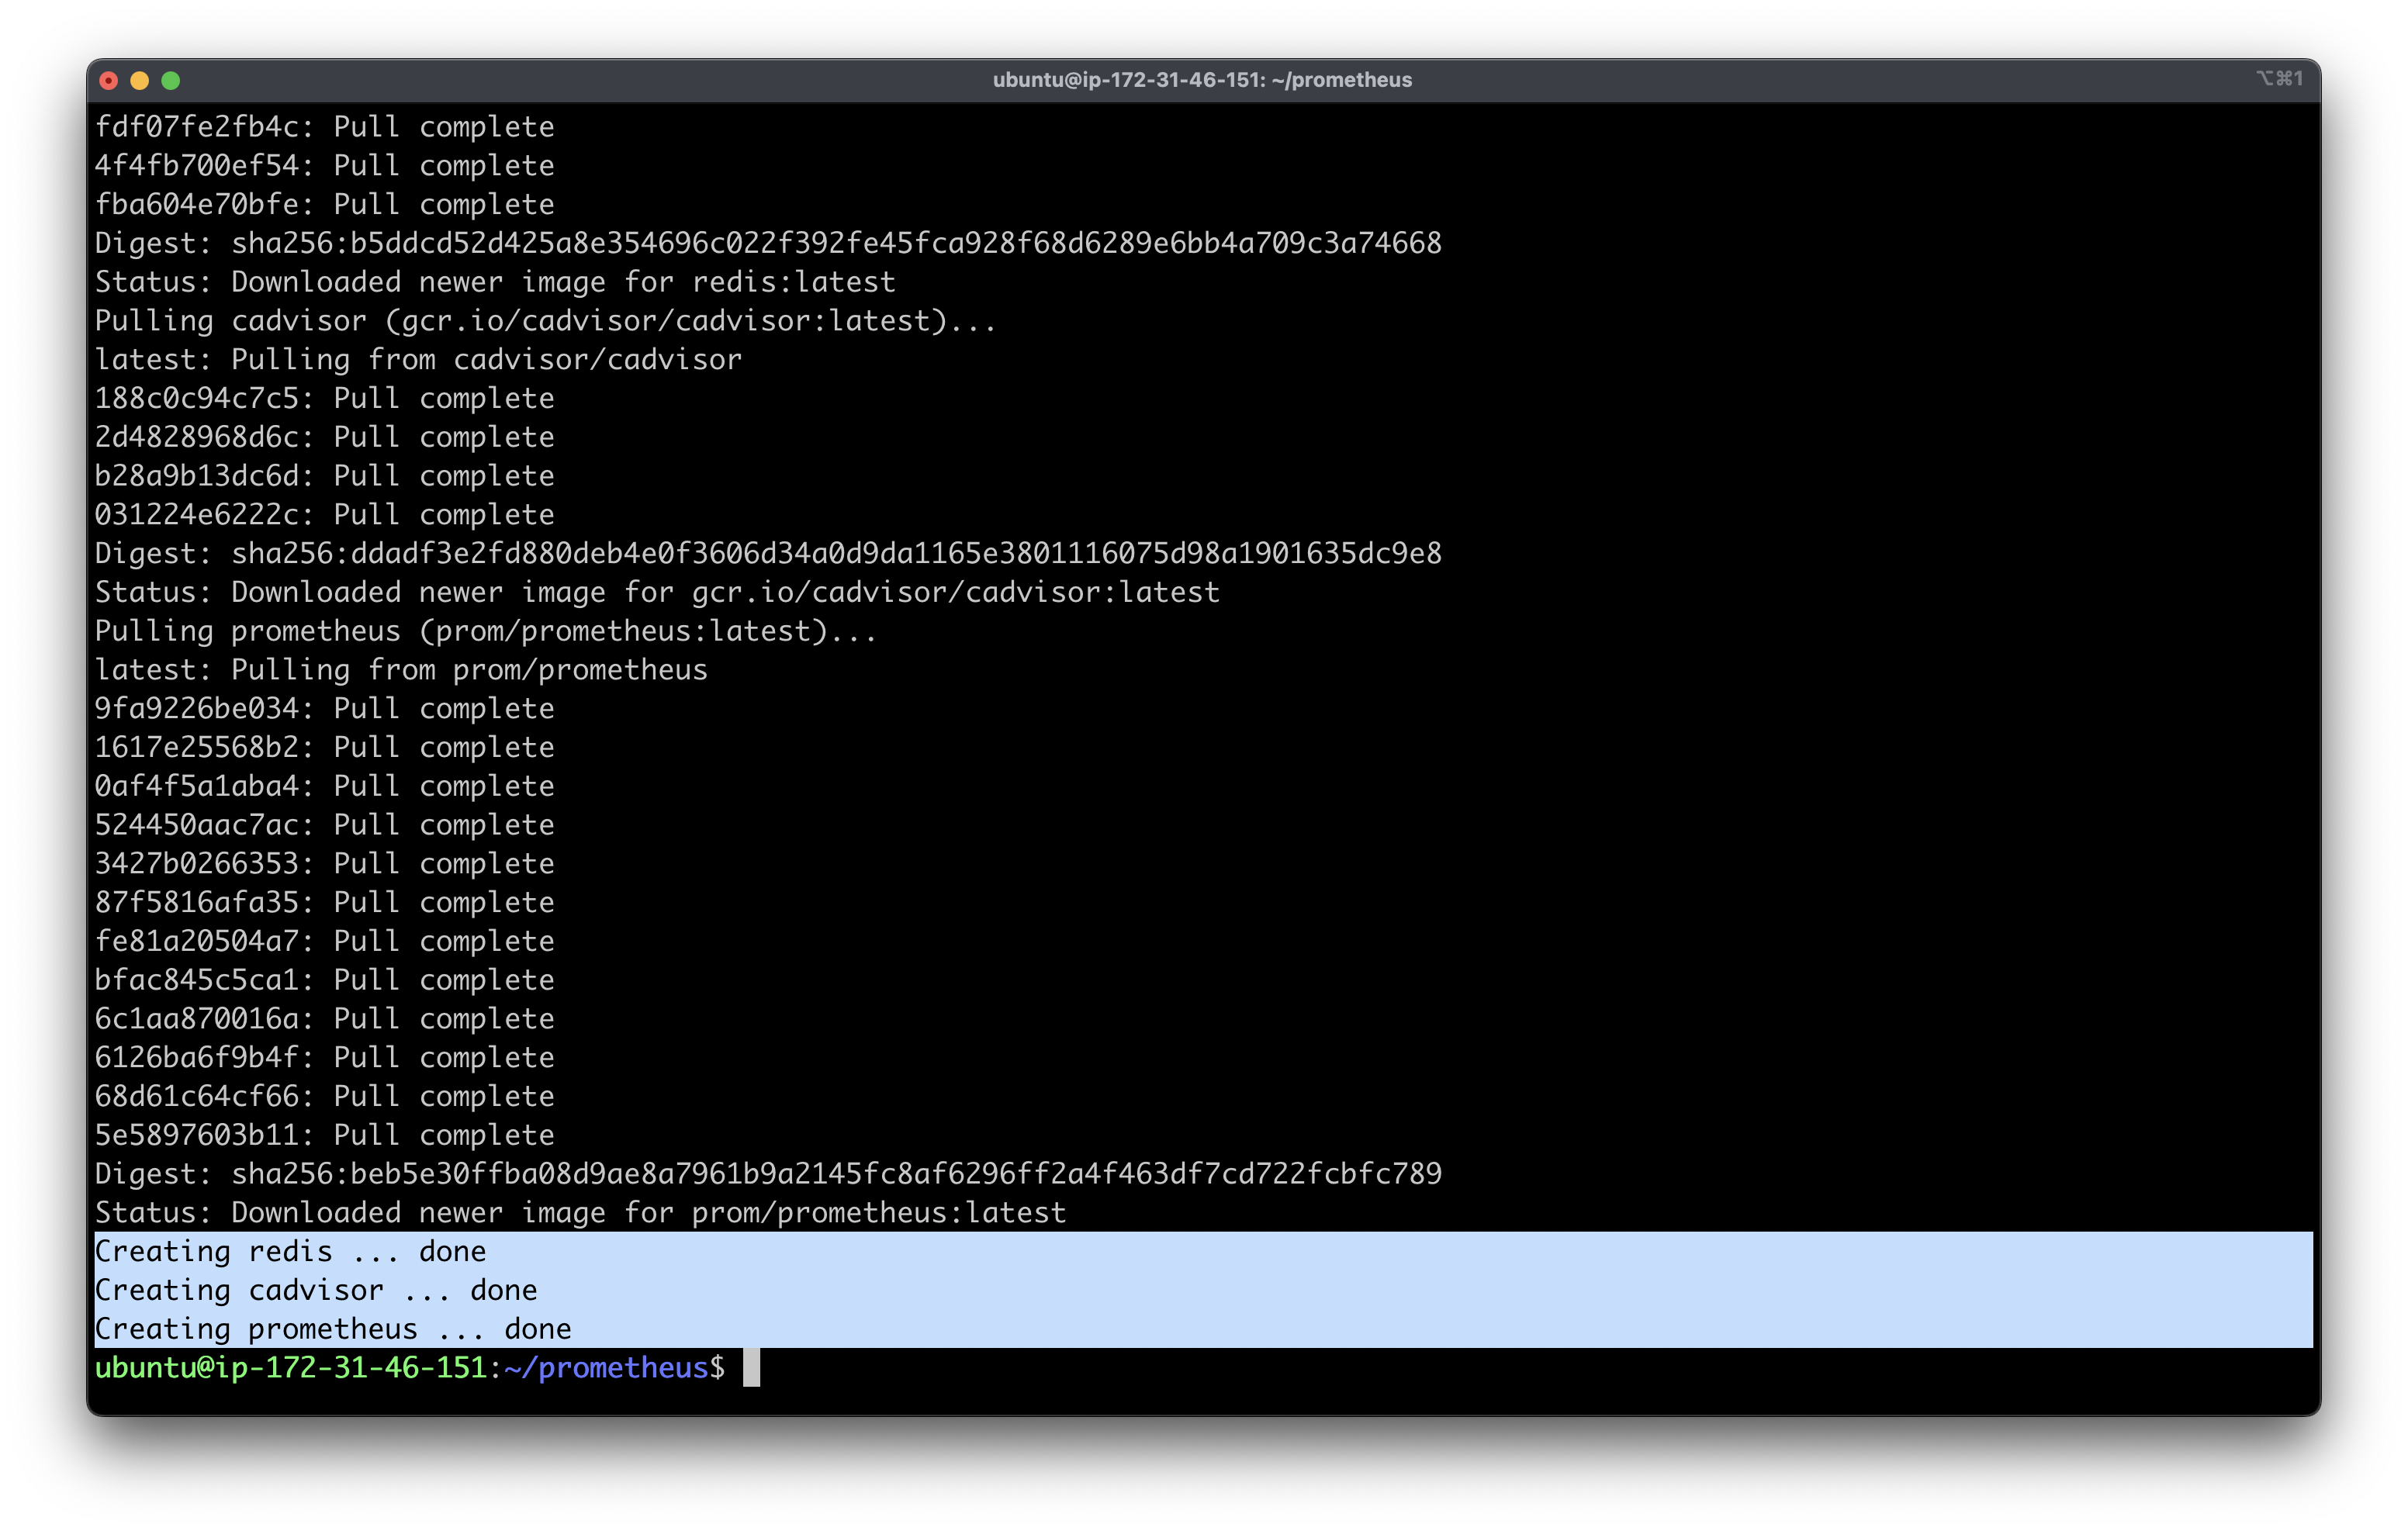
From this file, it will create 3 services. First Prometheus, second cAdvisor and third redis.

Run docker the docker compose up -d
In security group, open the port 9090, 8080, and 6379.
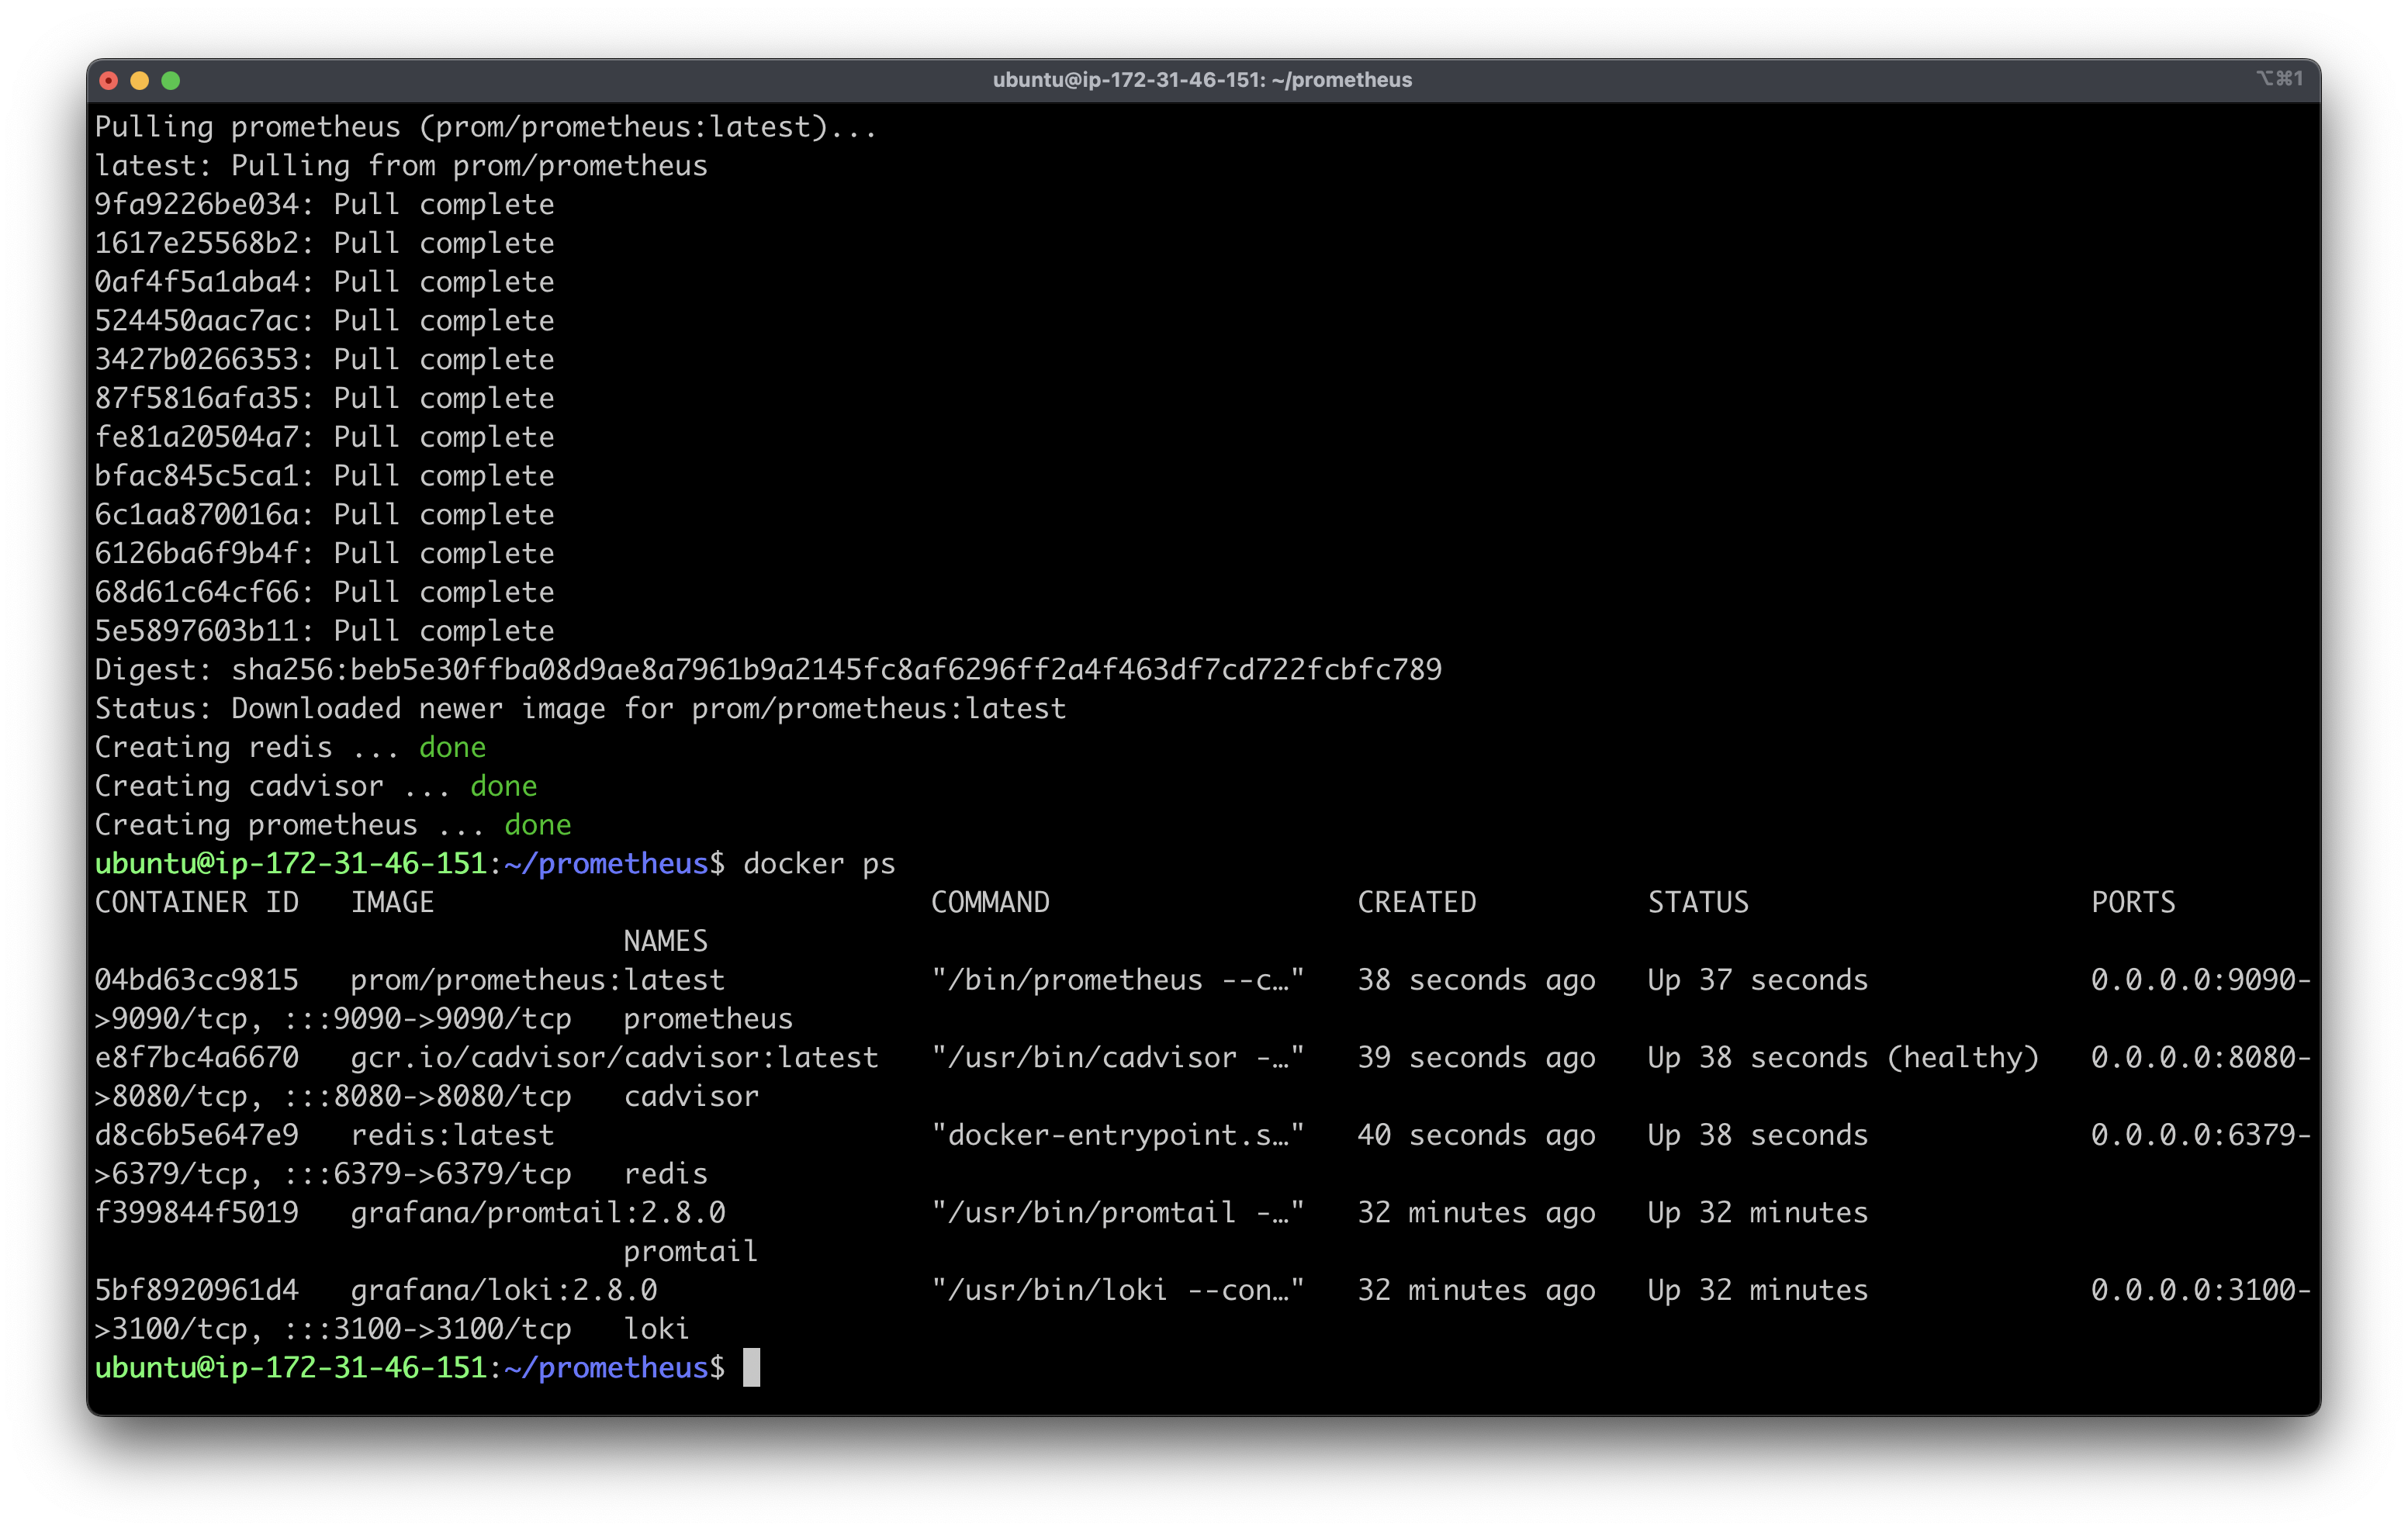
Premetheus, cadvisor and redis are now ready to work.
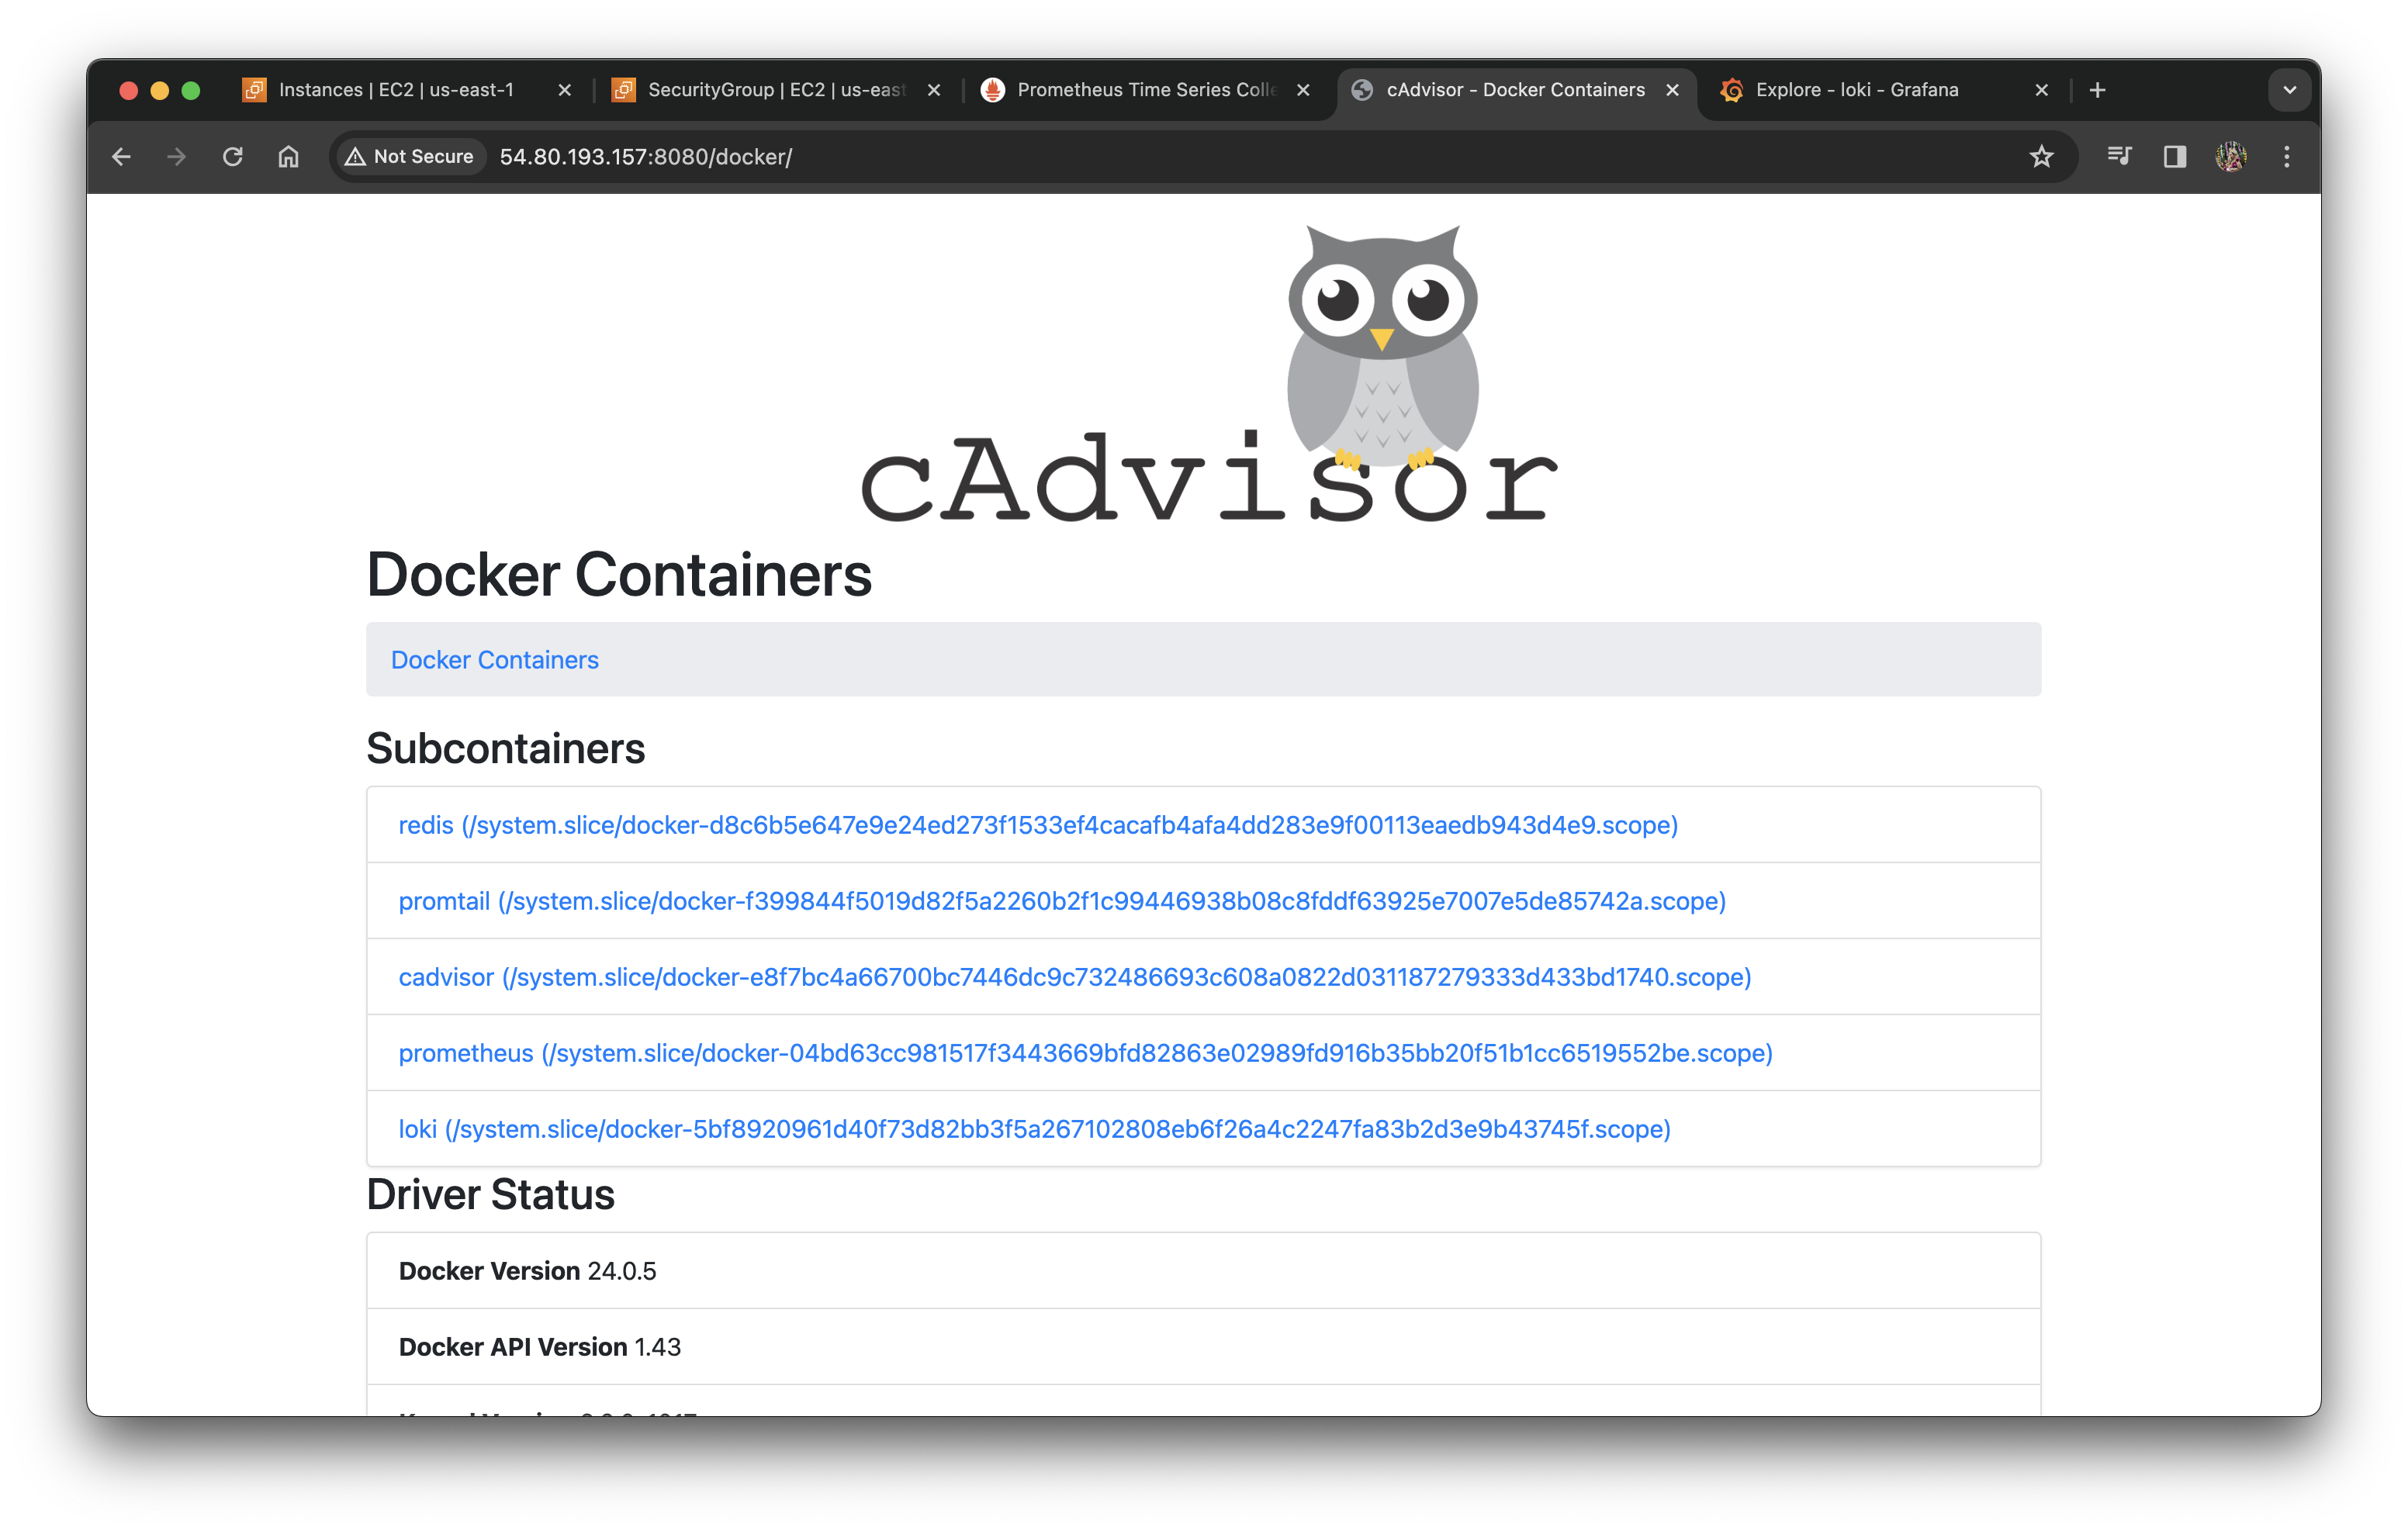
To access the cAdvisor visit port 8080.
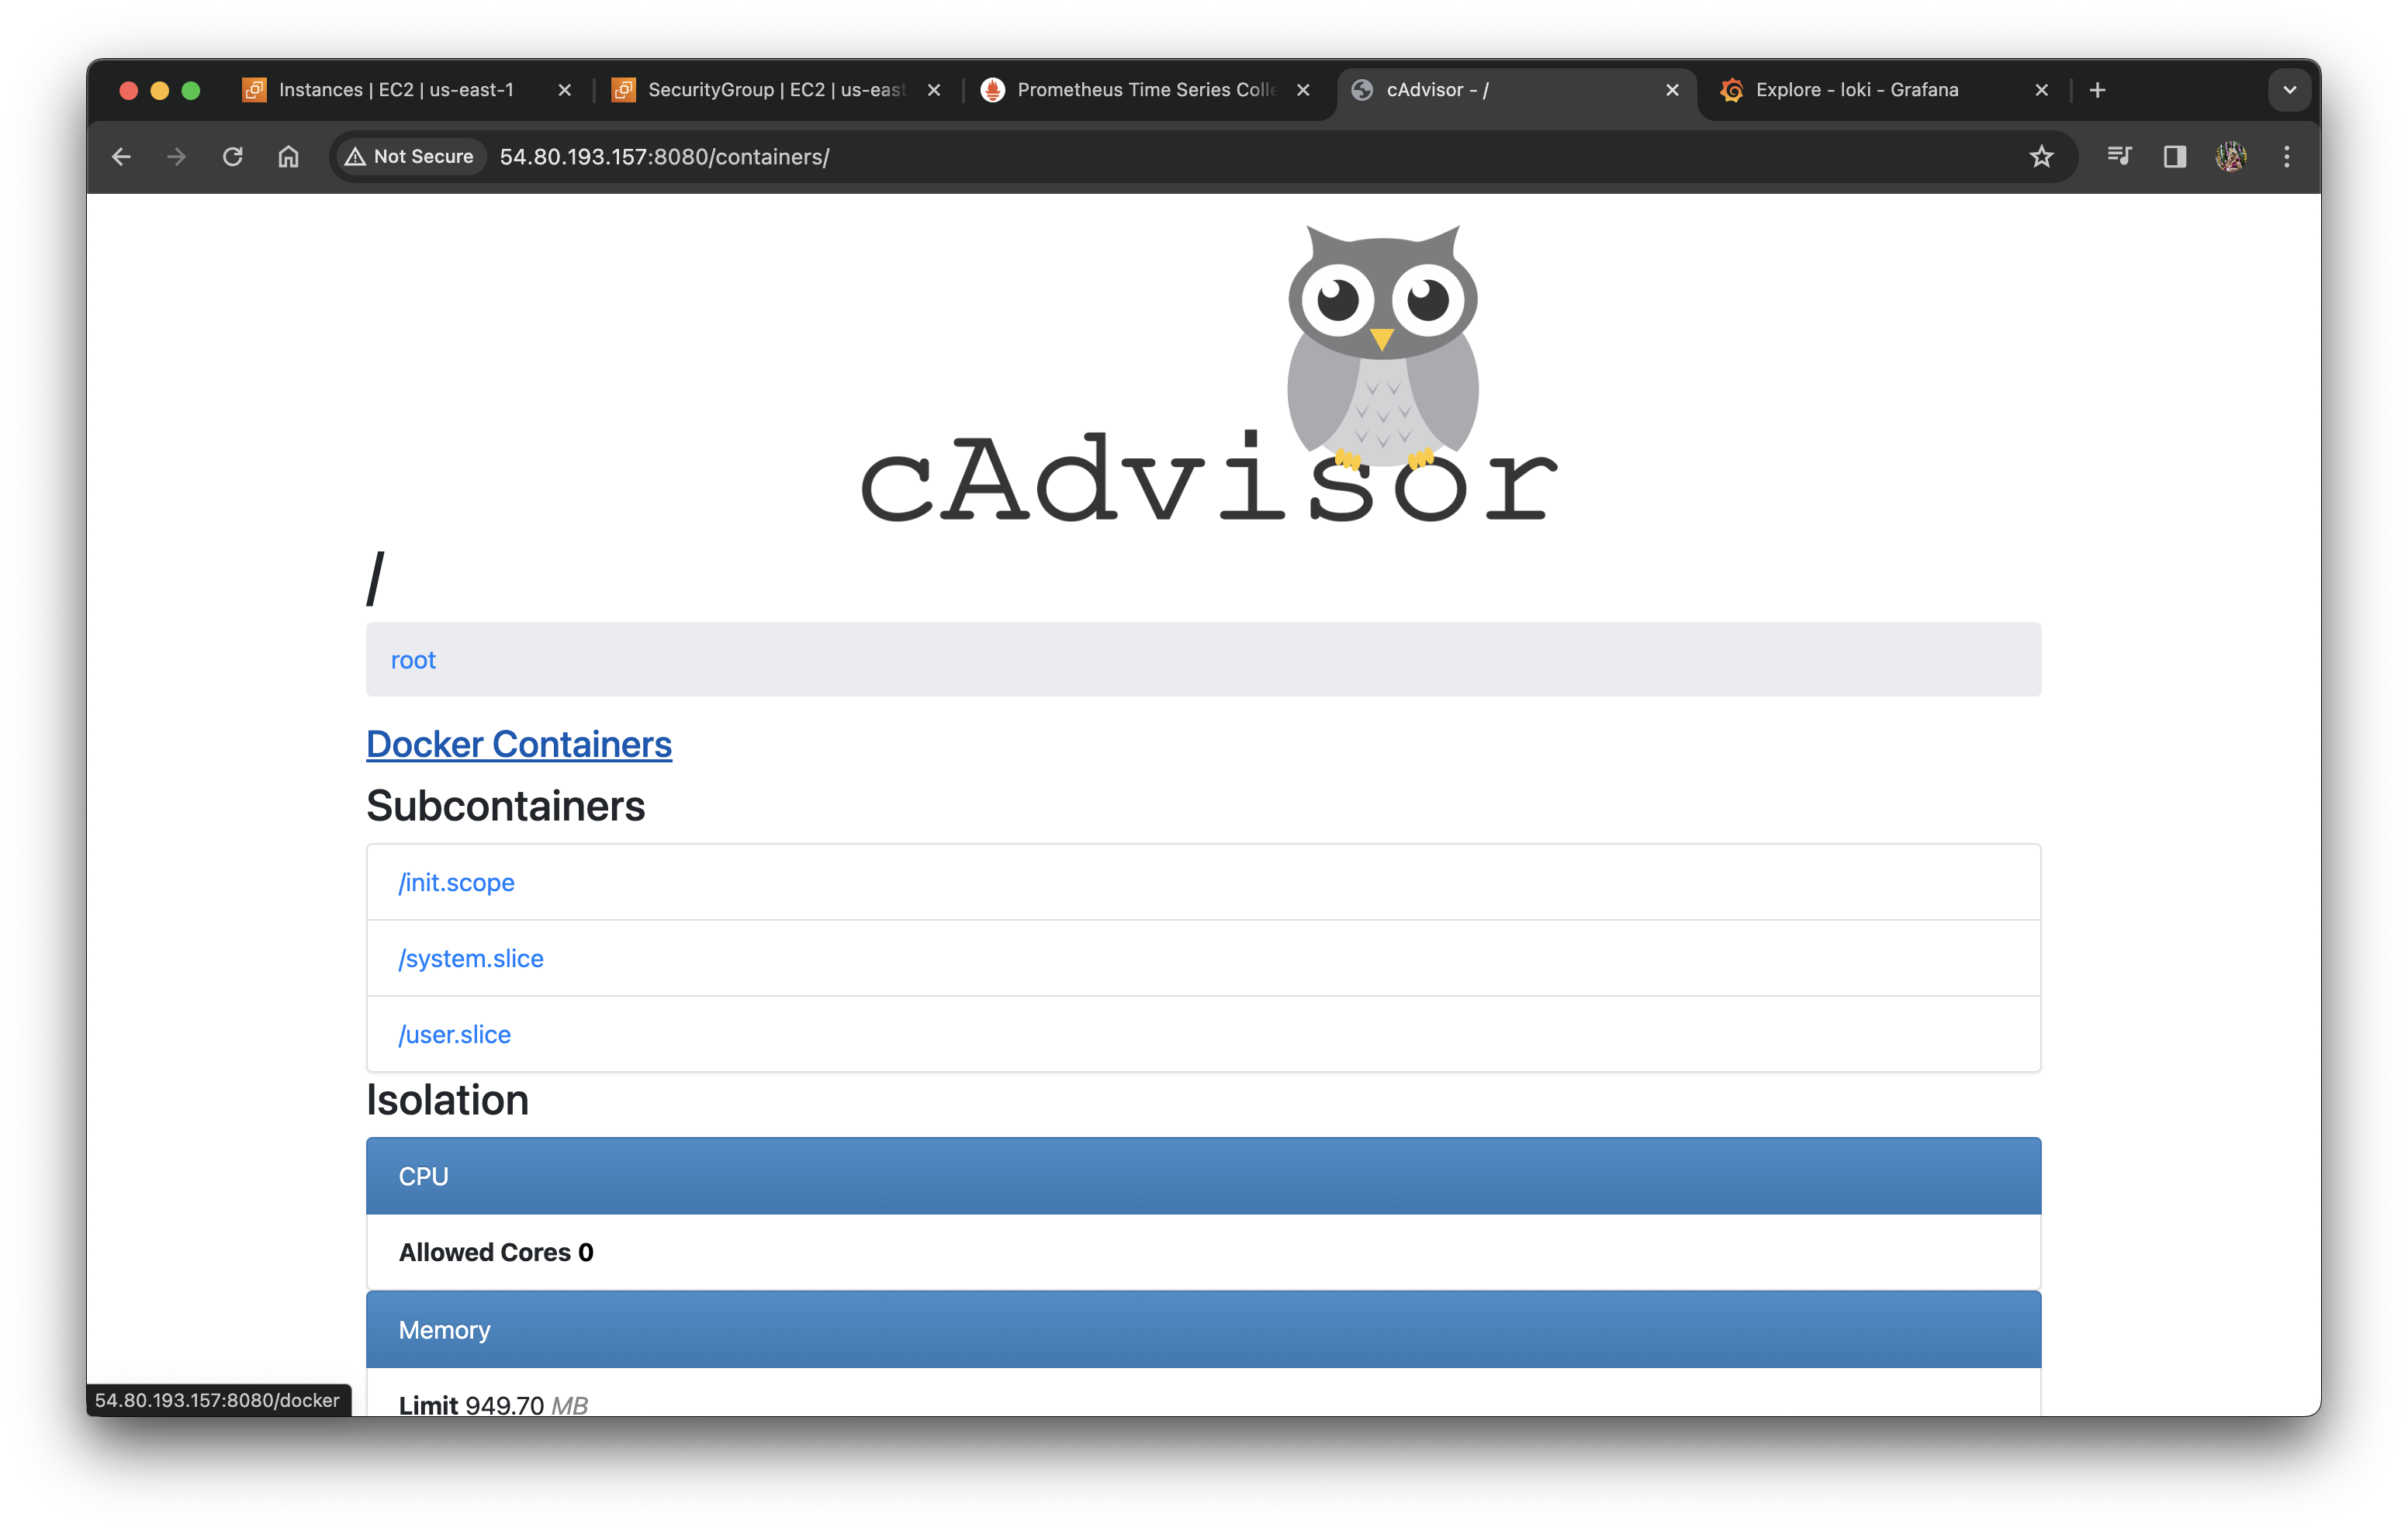
If you click on docker containers you will get all the docker containers' list.
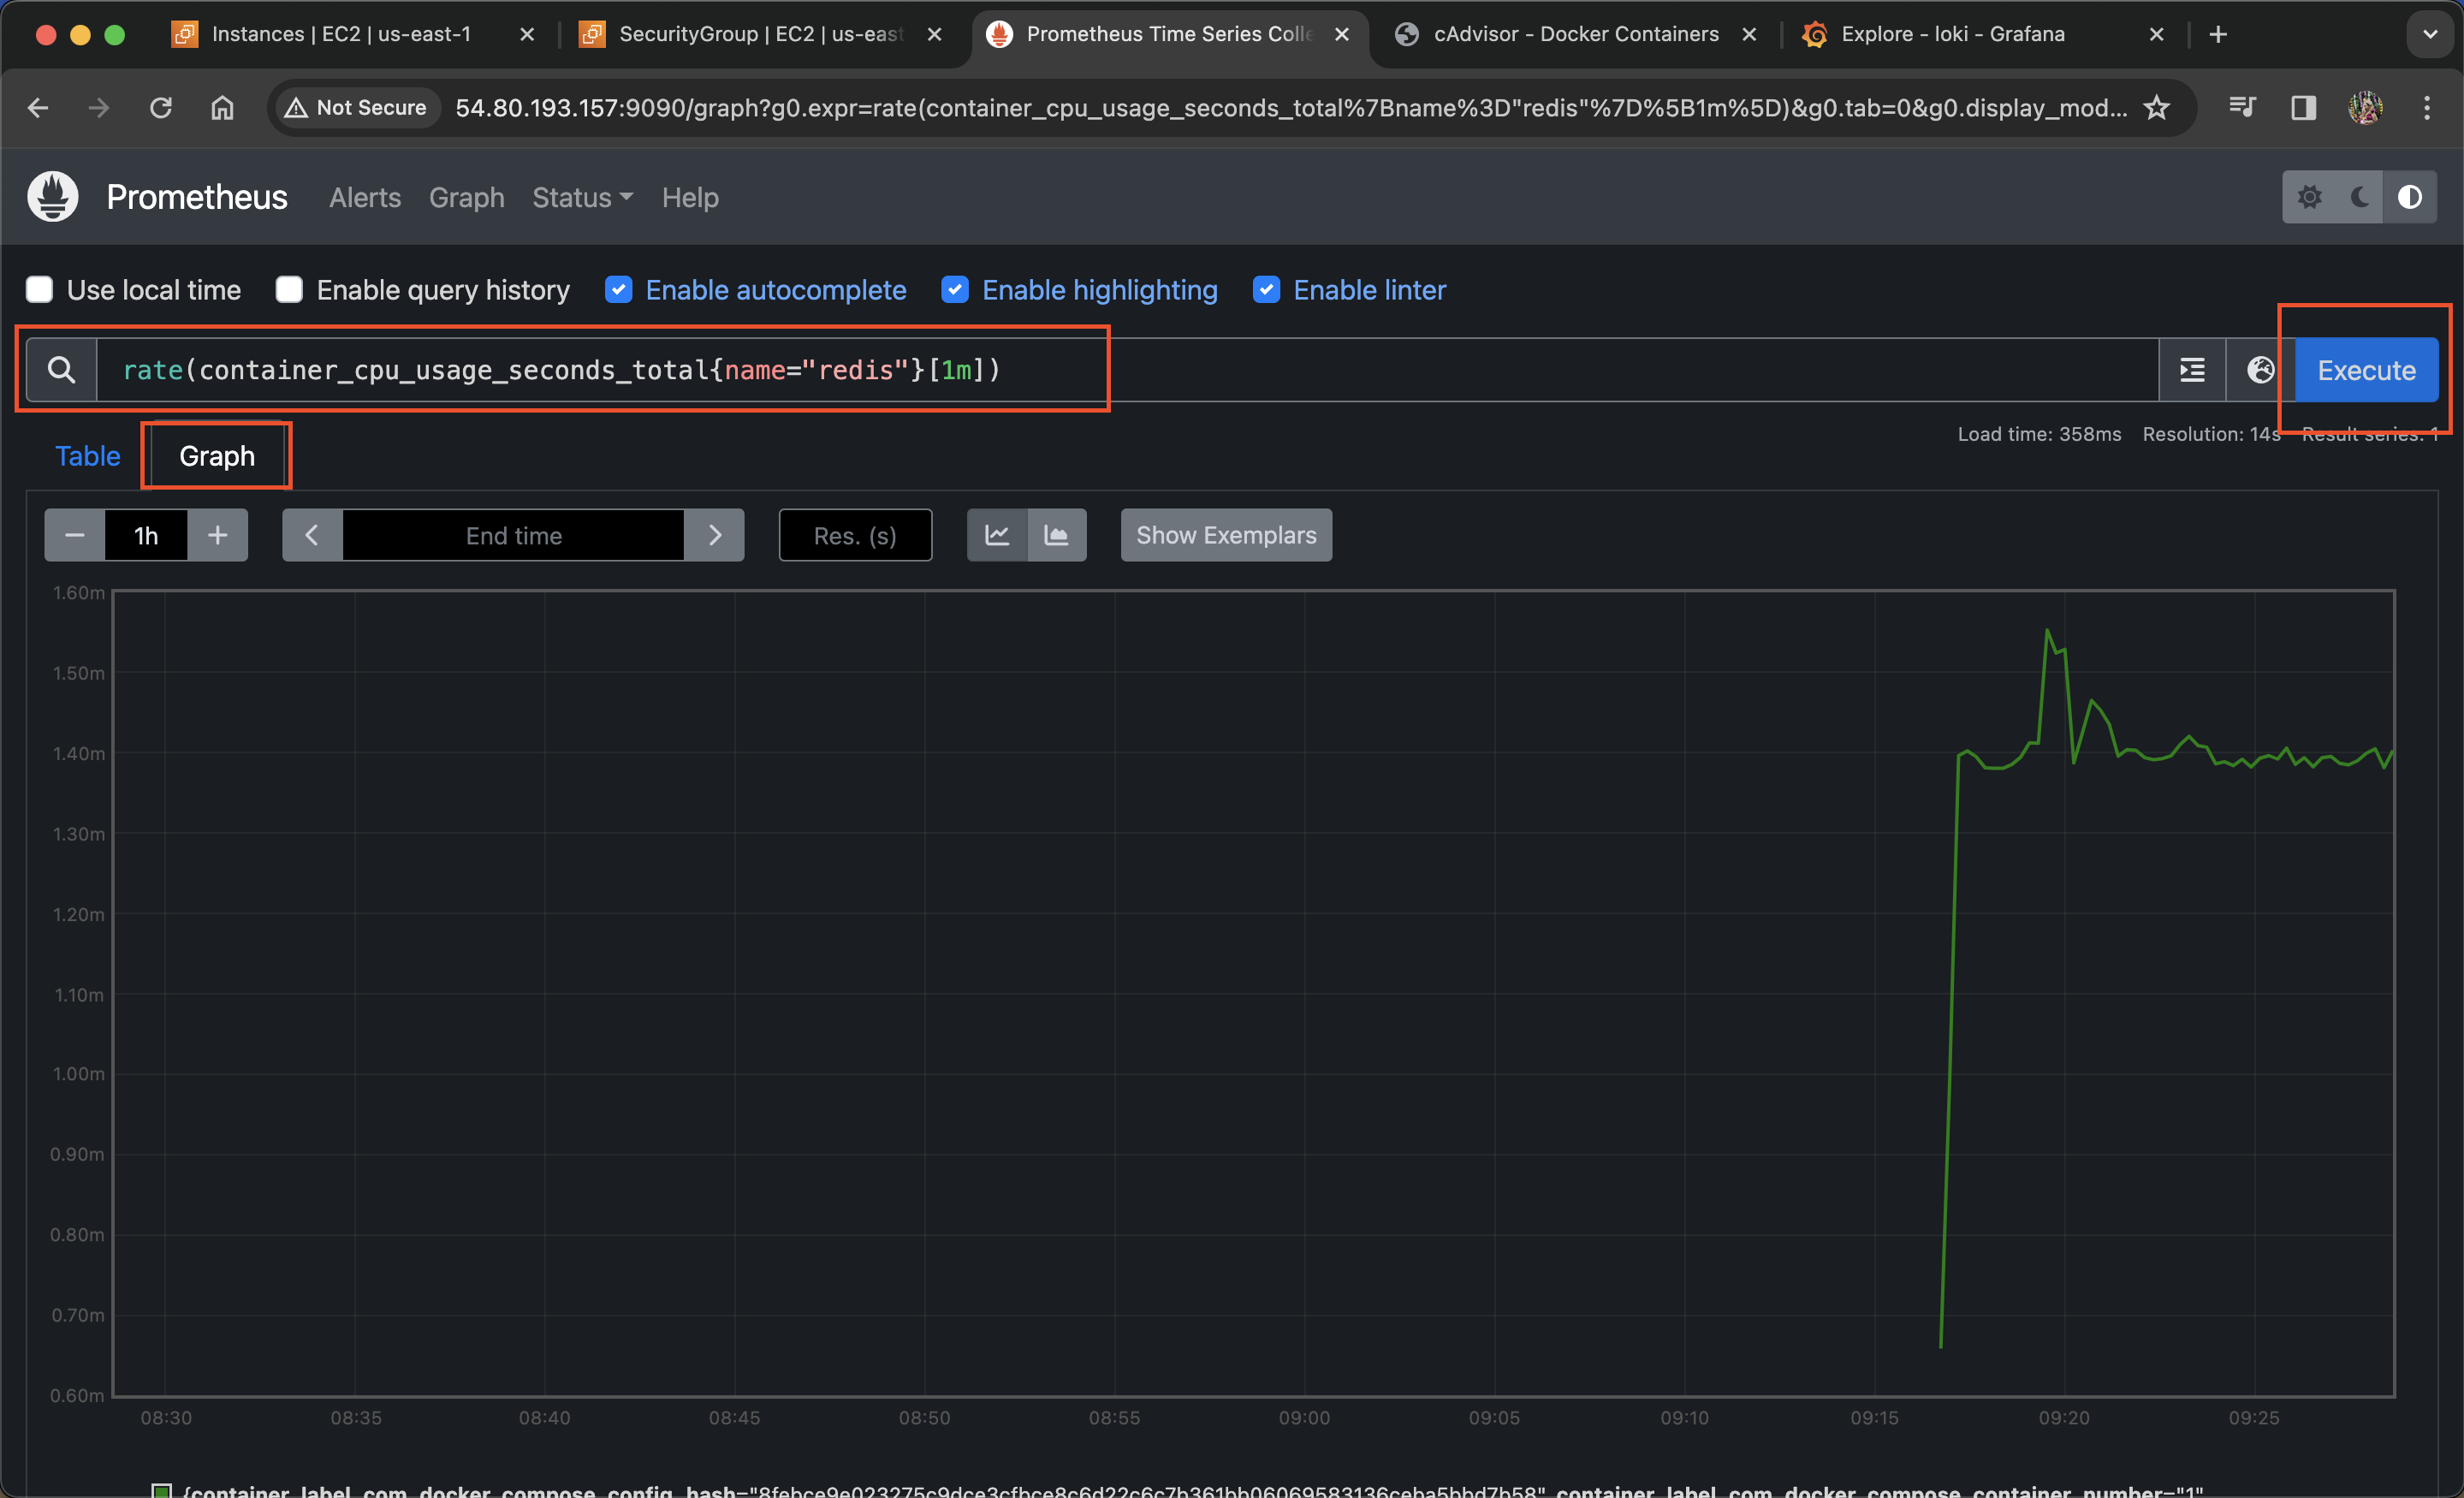
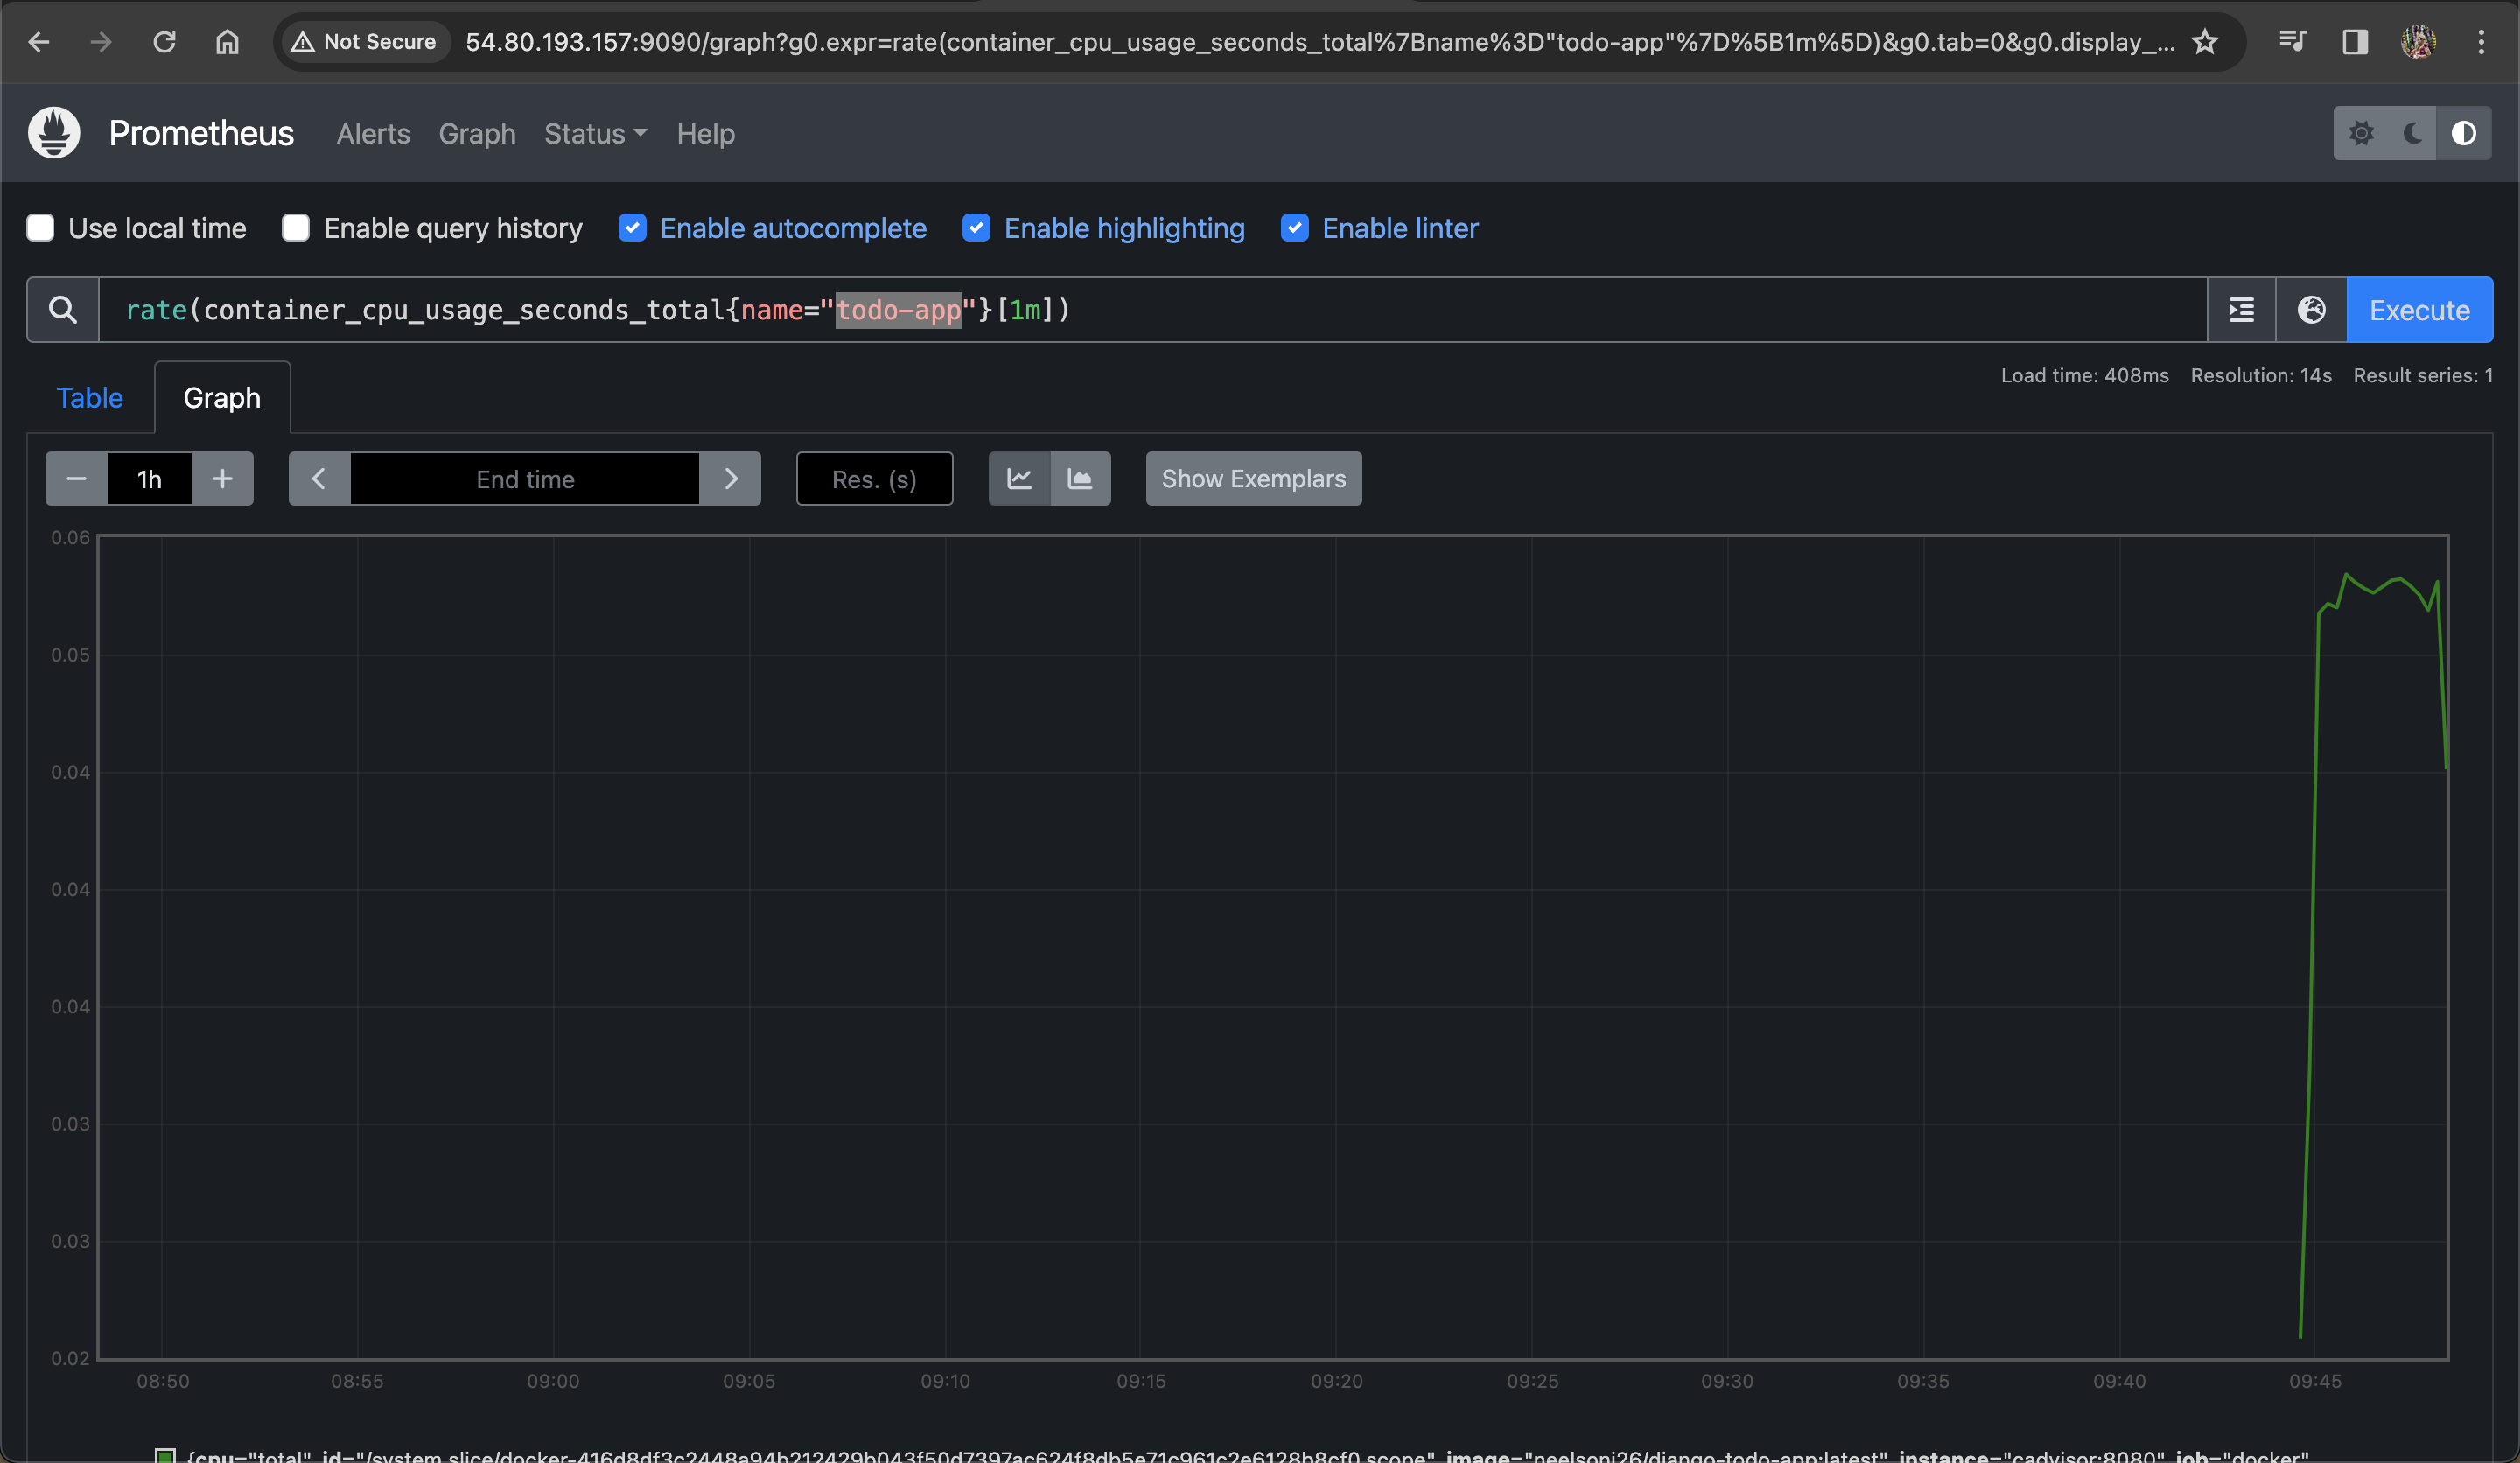
To access the GUI of premetheus goto <ip>:9090
i.e: http://54.80.193.157:9090/

You can run query here like:
rate(container_cpu_usage_seconds_total{name="redis"}[1m])

container_memory_usage_bytes{name="redis"}
Here, everything is working so let's get one web app from dockerHub and run them and after that monitor them in the Grafana.
Step #3: Install app to monitor
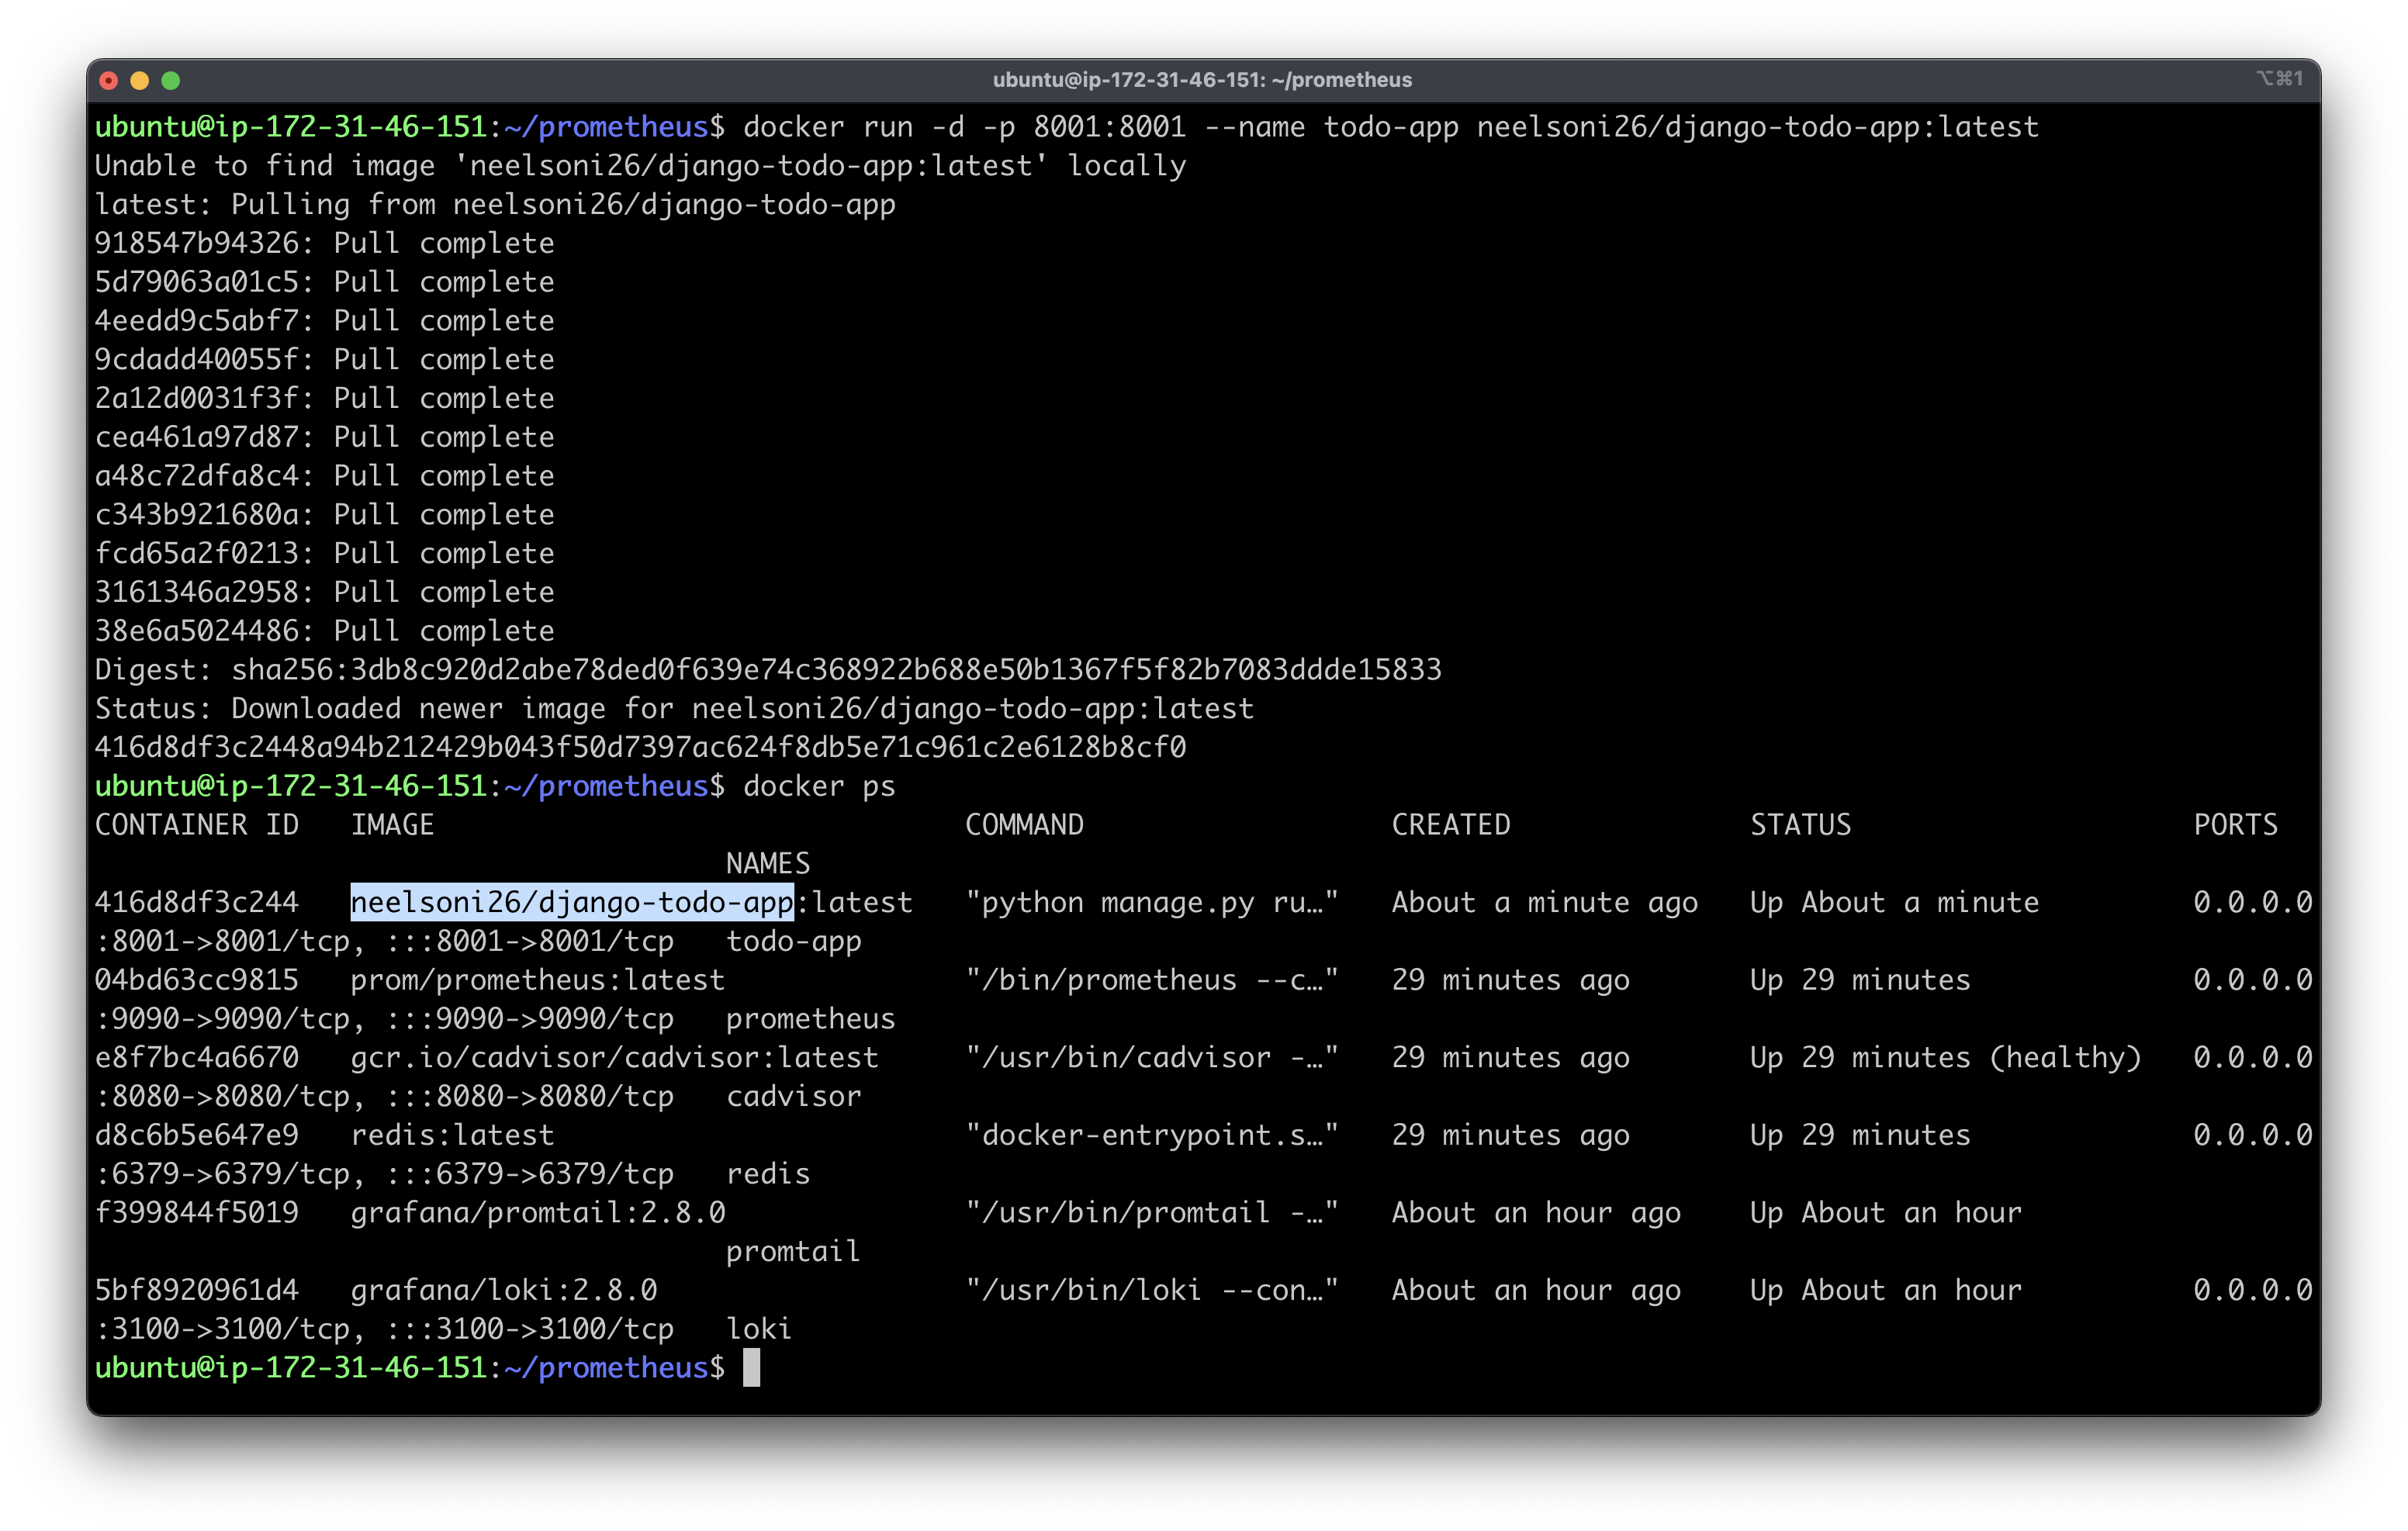
I have an app on dockerhub and will run here.
docker run -d -p 8001:8001 --name todo-app neelsoni26/django-todo-app:latest
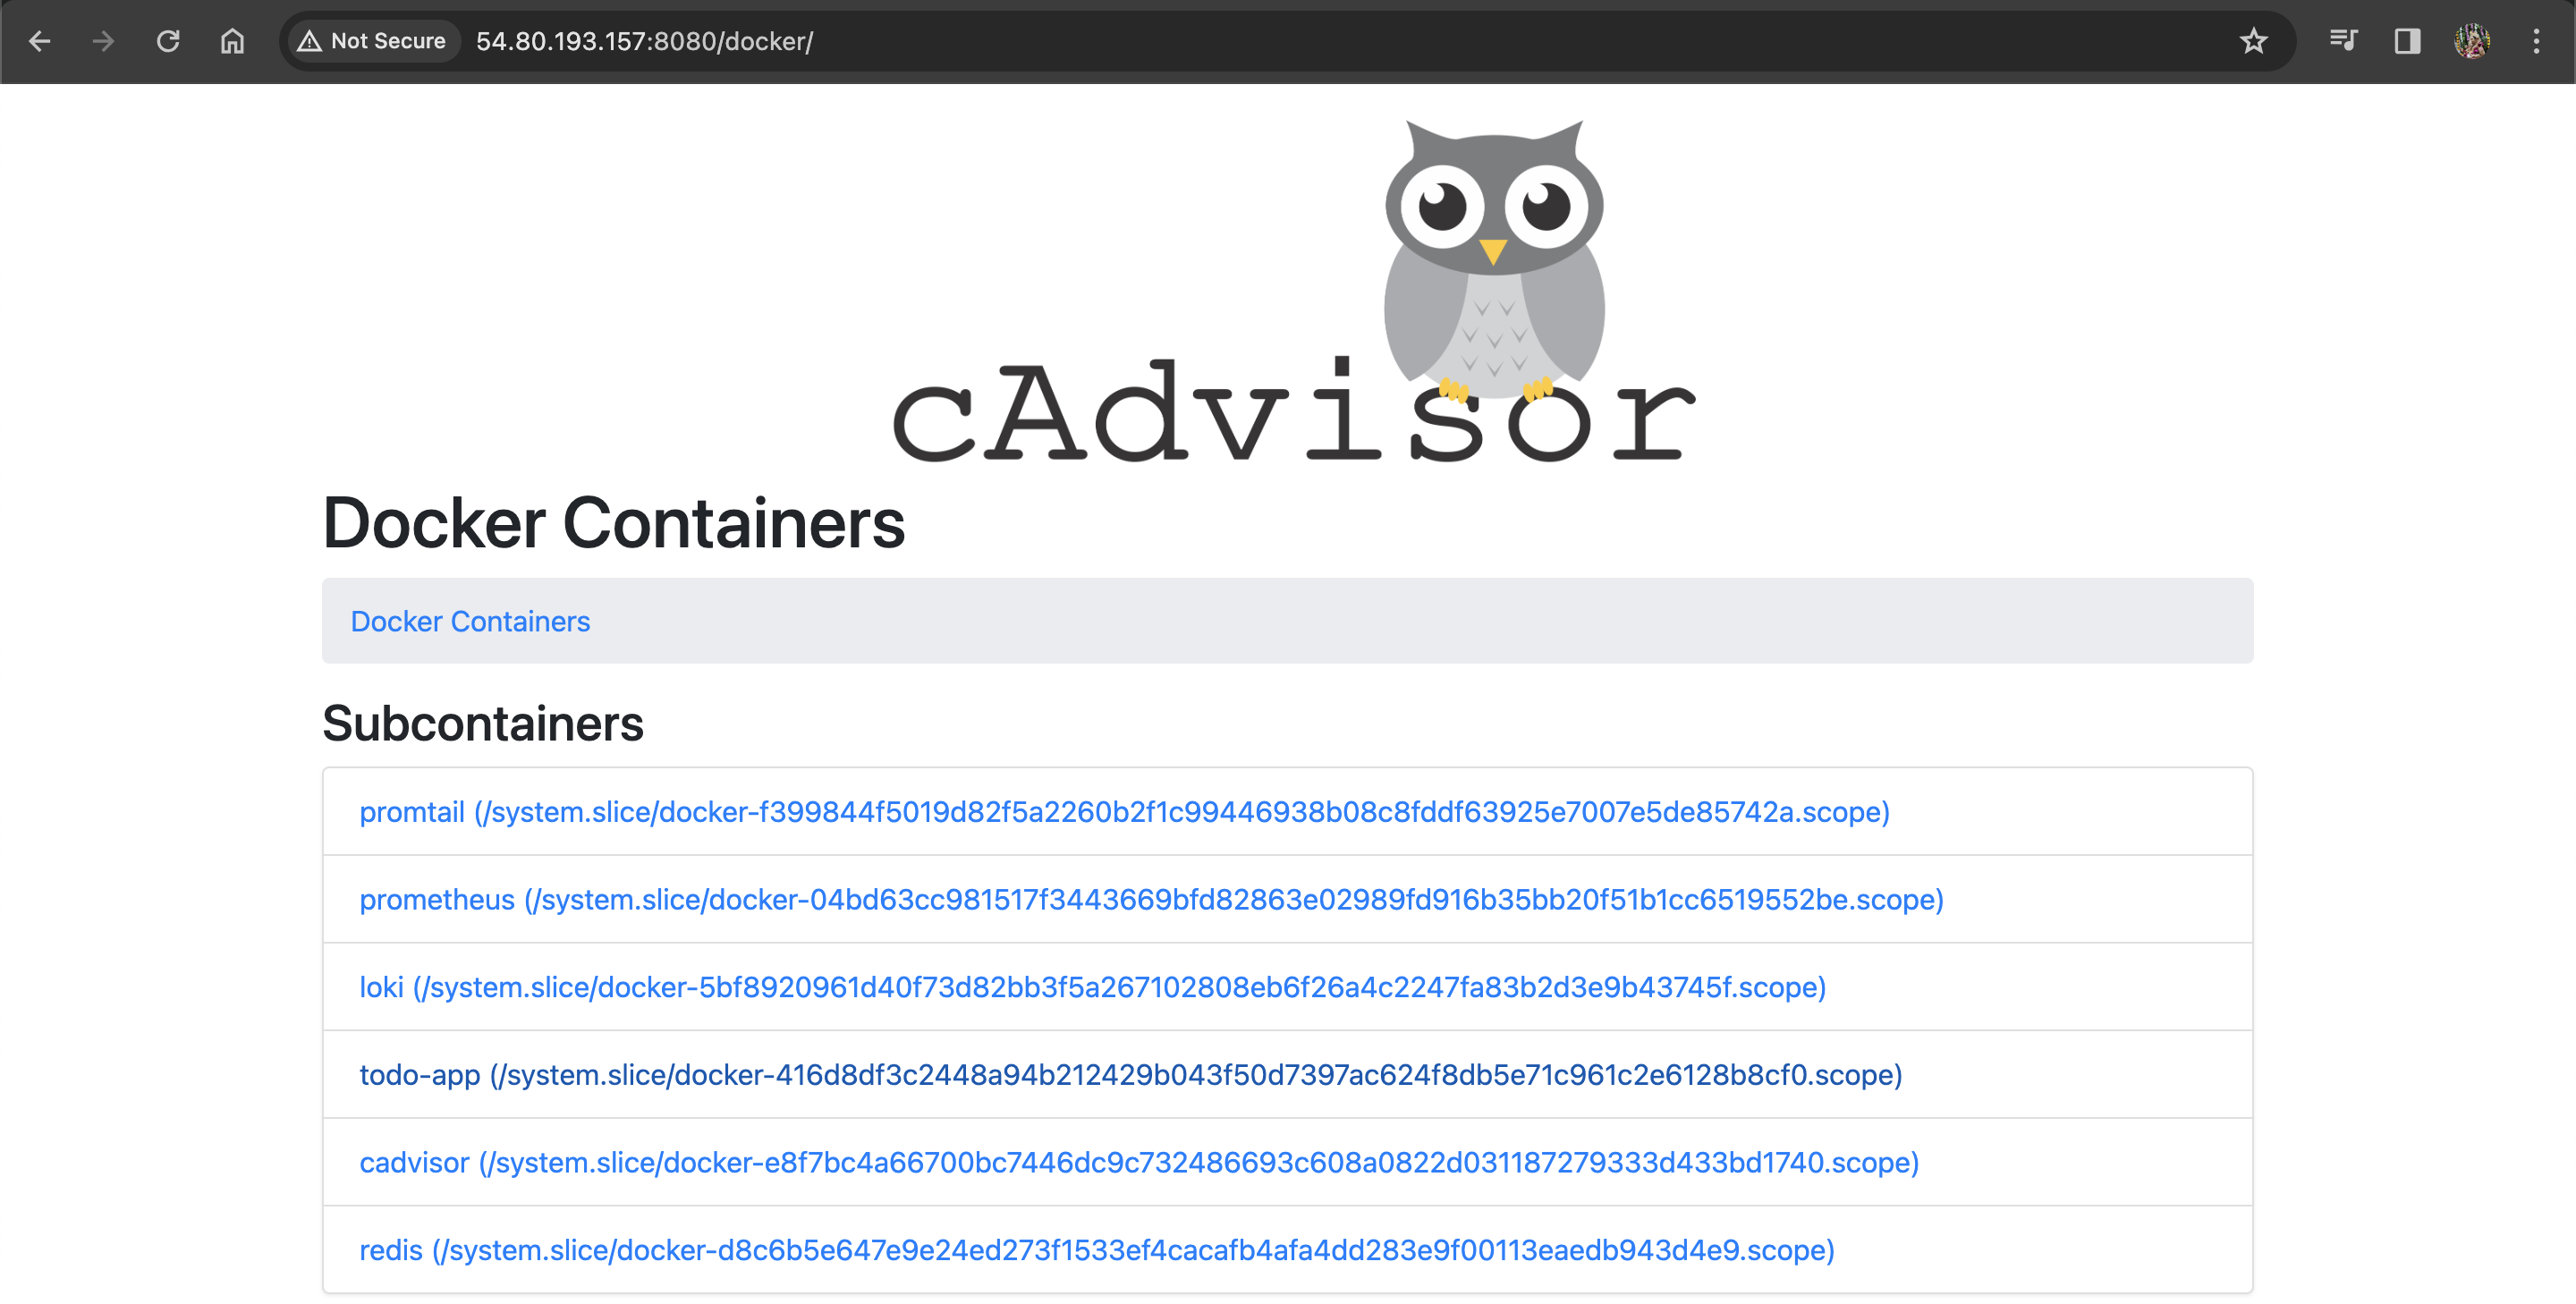
Open the 8001 port and run ip in the browser with the port.

Reload the cadvisor and check the todo-app
In the Prometheus, change the query and check the todo-app working.
Step #4: Configure Grafana and Prometheus
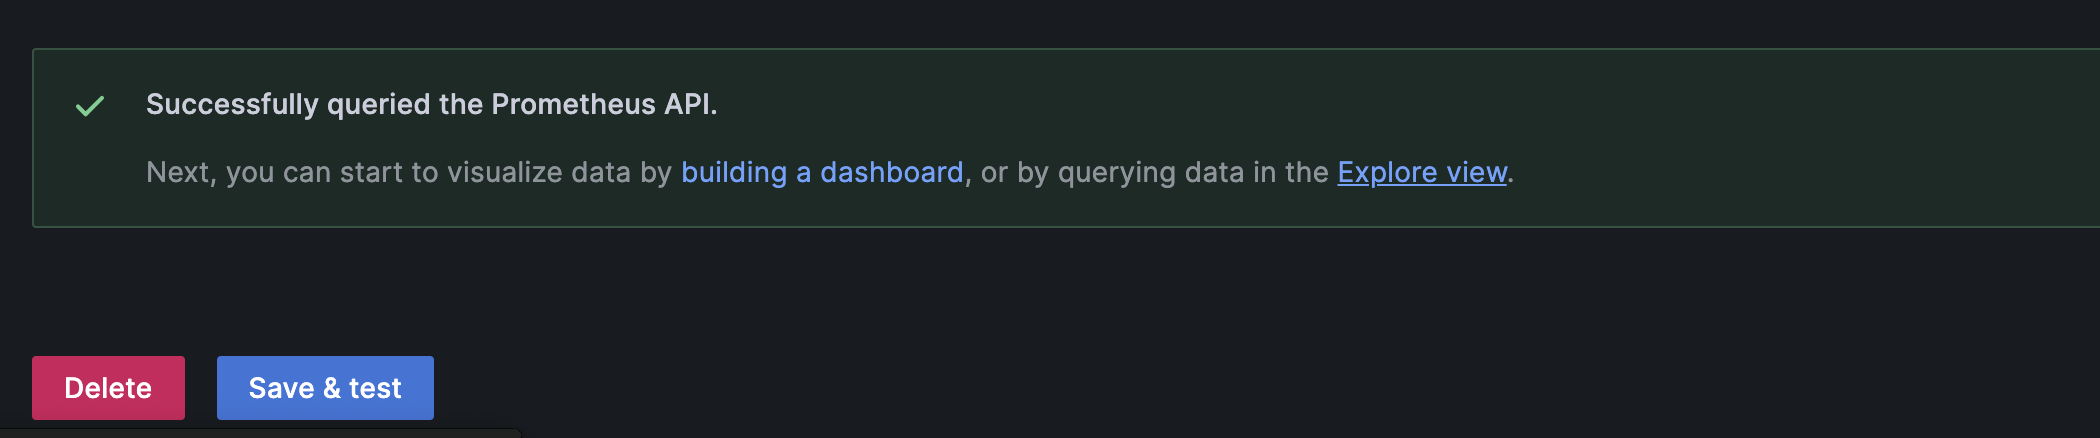
Go to grafana and add the resource Prometheus with the url http://localhost:9090


Click on explore view.

In the metric, select and run the queries.

Done! We are getting logs from the docker container to grafana.


